13 Sept 2000, PHS.
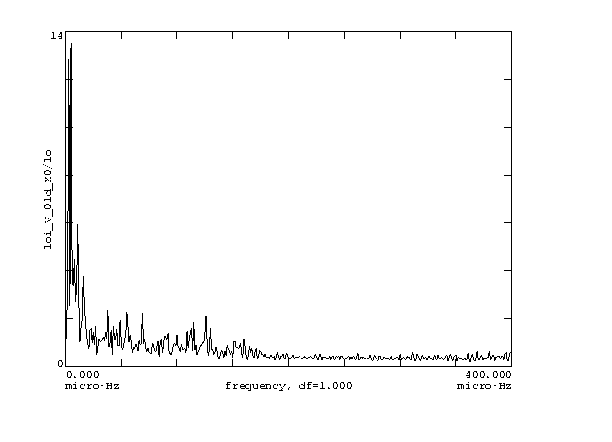
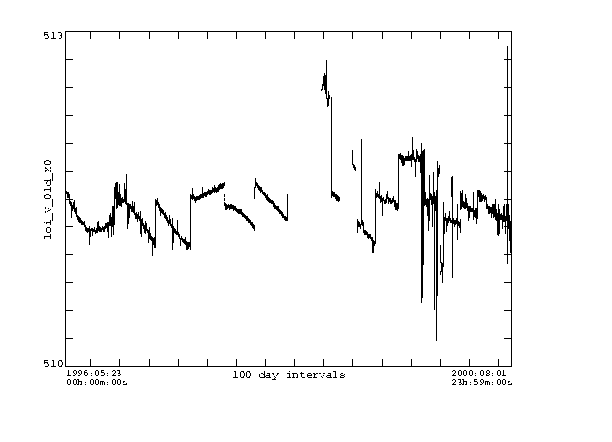
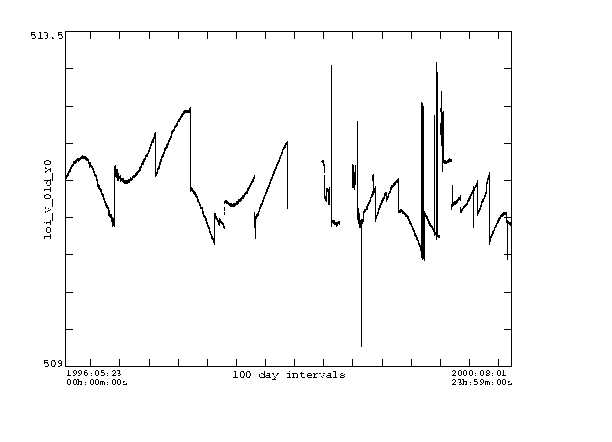
This is a check of the MDI image center determination data which is in the image headers in the parameters X0 and Y0 for the EW and NS center index respectively. The units of X0 and Y0 are 2-arcsecond pixels. The units of the power spectra below are in log10 of pixels^2/microHz.
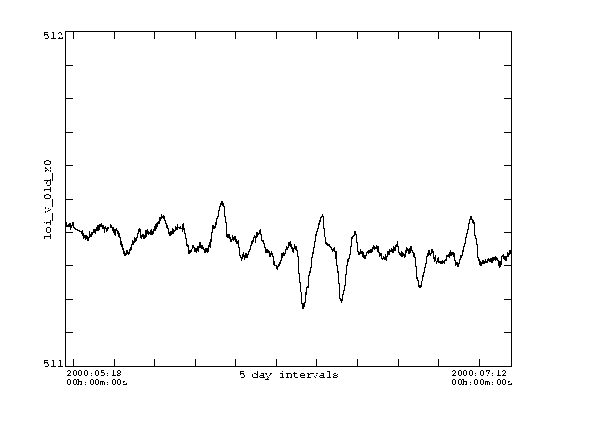
The first plots are X0 and Y0 for May 1996 to Aug 2000. The jumps are times when the legs were moved, and/or when the pointing offset was changed and/or times when focus was changed. Clearly the X0 data is noisier than the Y0 data. This is to be expected since solar rotation carries structures past the EW limb sensors but not past the NS sensors. A plot of about 2 months in the spring of 2000 are also shown. The signature of activity rotating over the limb can be seen in the X0 data. This represents real motion of the image on the CCD. Any analysis that cares about the exact position of the image must use X0 and Y0 (or their derived quantities - see Lev2 keywords info) to determine the disk center coordinates.
Inspection of X0 over the 4+ years of operations shows increasing image motion due to solar activity. Note that in 1998 just after the break the curve looks similar to that just before the break. The motion grows with time as the cycle increases.
X0 May 1996 to Aug 2000

Y0 May 1996 to Aug 2000
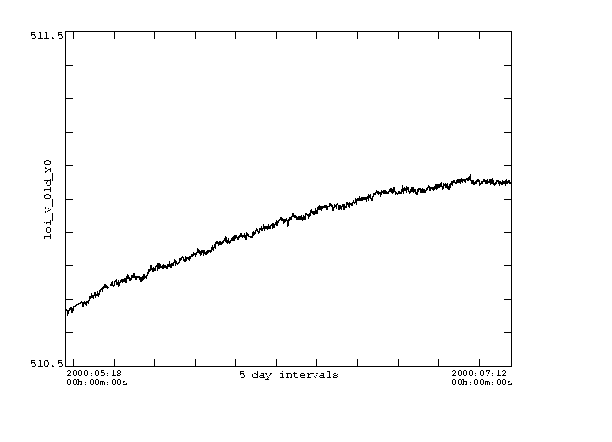
X0 May 18 2000 until July 12. Selected to avoid large jumps.
Y0 May 18 2000 until July 12. Selected to avoid large jumps.
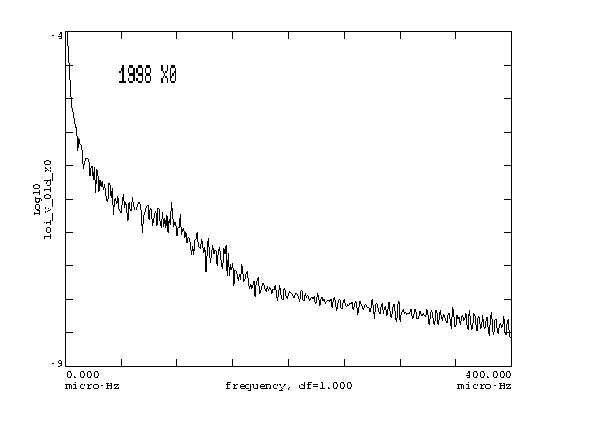
X0 Power spectrum of 3 months in 1998
The data is derived from 12 minute samples of 23-minute qaussian smoothed Ic data of an annulus at the limb. The data is processed by removing outliers from a
running median over some length (order days) then smoothed and interpolated to
the observation time of each target data product. This data is on a 1-minute
grid. The break at about 170 microhz may be due to the 96-minute magnetogram cycle which mixes 30-second and 60-second Ic samples prior to the on-board 23 minute smoothing.
The main peak from 0 to 20 microHz corresponds to instrument drift and
the rotation of activity.
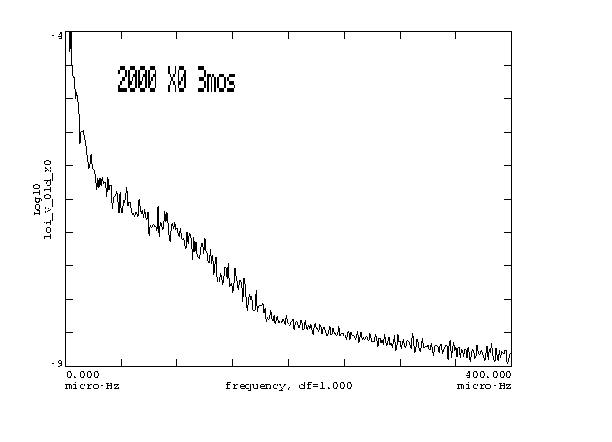
X0 Power spectrum of 3 months in 2000
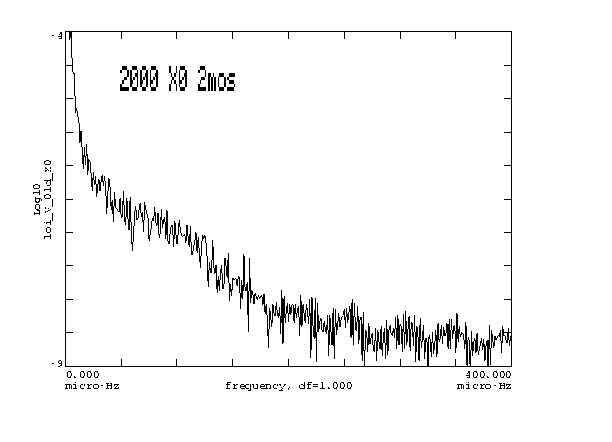
X0 Power spectrum of the May to July interval above. Apparently the jumps
do not much change the spectrum.
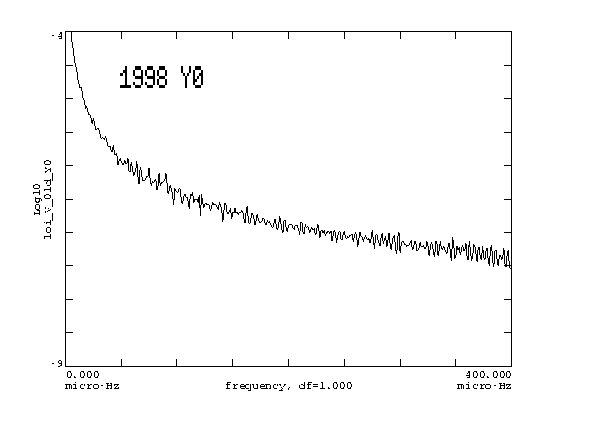
Y0 Power spectrum of 3 months in 1998
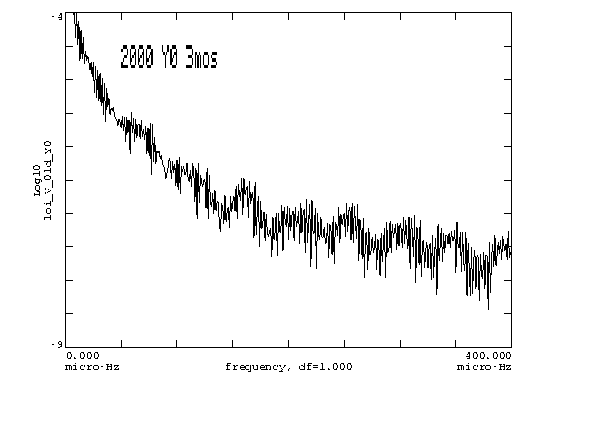
Y0 Power spectrum of 3 months in 2000
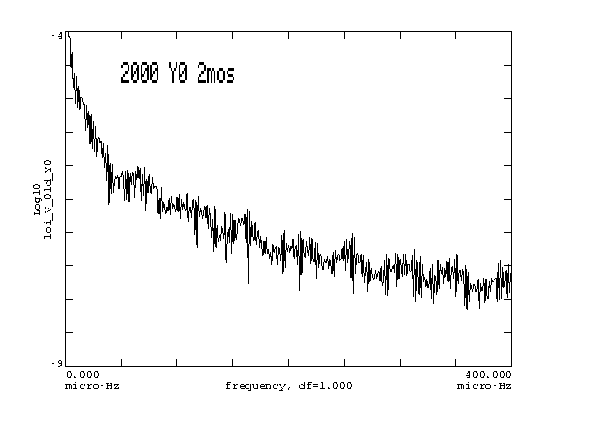
Y0 Power spectrum of the May to July interval above. Apparently the jumps
do not much change the spectrum.
This plot is similar to the 1998 plot. I do not know why there is more
power at higher frequencies in Y0 than in X0.
This plot is the ratio of the 3-month spectra for X0 for 2000 / 1998. It can be seen that most of the difference is at low frequency, below about 20 microhz which corresponds to about 14 hours. Thus in the g-mode band from 1 to 12 hours where we might reasonable search MDI data there is little difference from 1998 to 2000. There is less power in the 3-month 2000 segment above 200 microhz than in 1998. Do not know why.
Two conclusions:
