 |
 |
SOI TN 03-146
P. Rose & R.S. Bogart
2003.10.20
This document provides a design and interface specification for the archiving and processing of full-disc, high-resolution (1024x1024 pixel array), and low-resolution (512x512 pixel array) solar Doppler data from the Magneto-Optical Filter (MOF) on the Mt. Wilson 60-ft Solar Tower. The aim of the project is to provide an ongoing publicly-accessible archive of original and processed data from the instrument, ultimately covering the duration of the observing series from 1987 to present date.
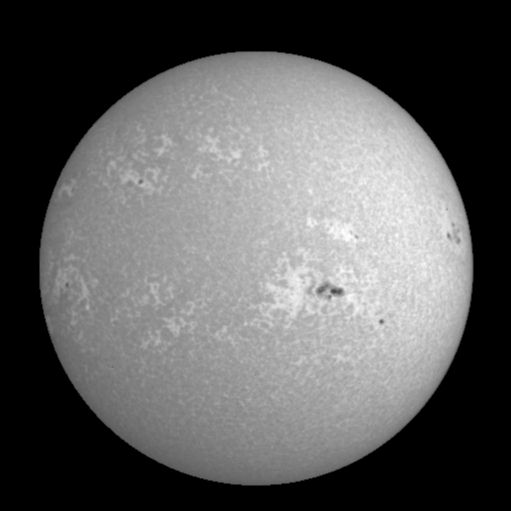
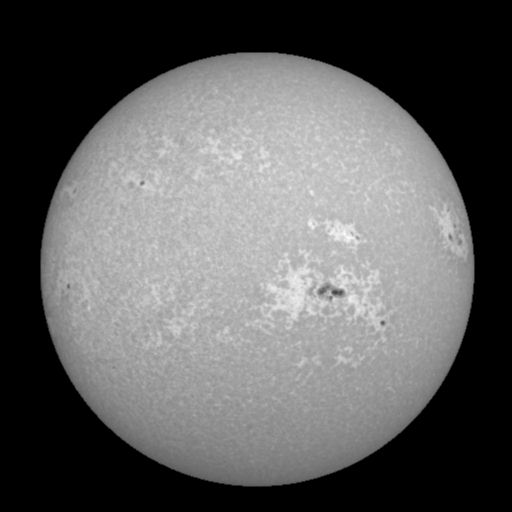
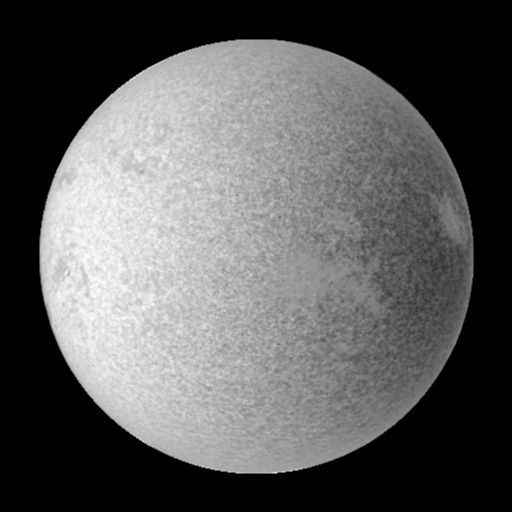
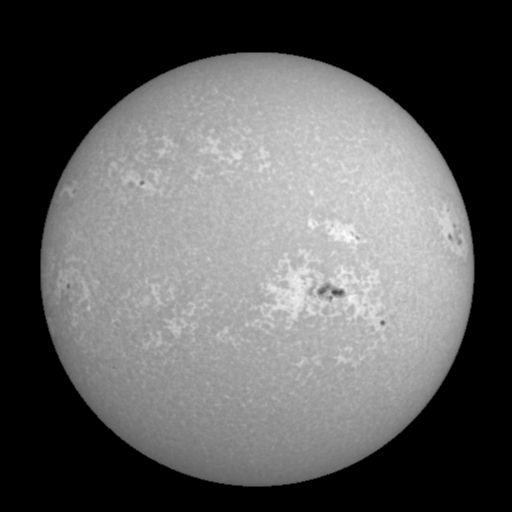
The Level-0 filtergrams are obtained with an automated data acquisition system using the Magneto-Optical-Filter (MOF). The MOF allows for the selection of a right-circularly polarized component of a very narrow portion of the wavelength being sampled, or a left-circularly polarized component, shifted to a slightly lower wavelength. A pair of solar images are taken every minute in these doppler-shifted wavelengths producing a red-shifted component, and a blue-shifted component of the primary wavelength of the cells being used, in this case either potassium or sodium.
|
|
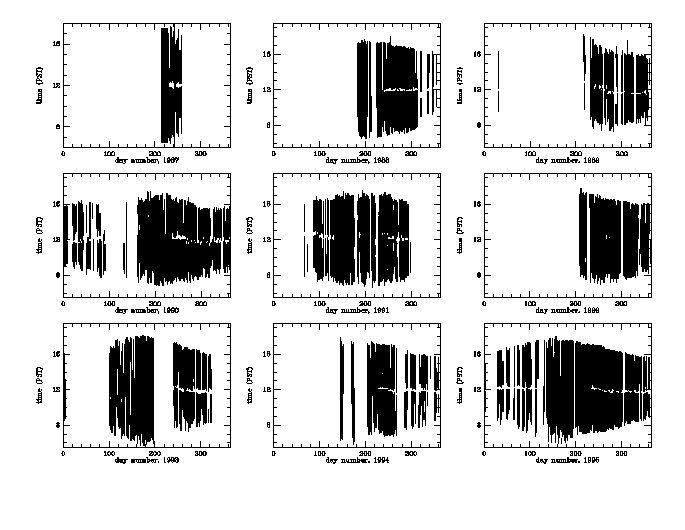
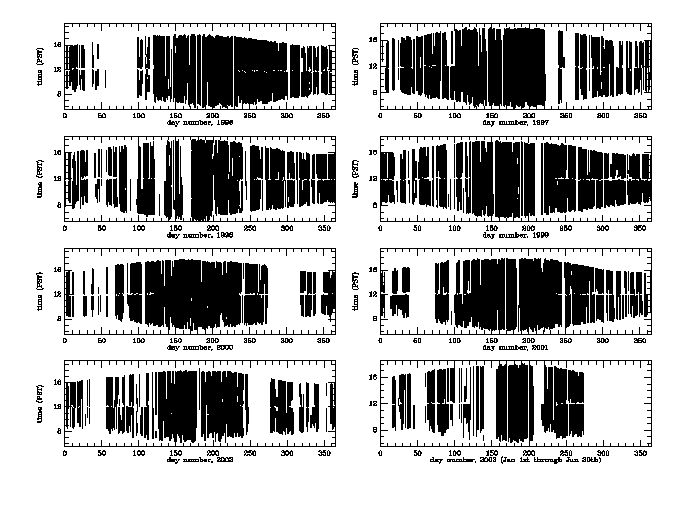
Observation histories for all 17 years of the Level-0 filtergrams are broken down into two categories; the pre-MDI era, and the MDI-era. The MDI instrument on the SOHO spacecraft became operational in early 1996, so observation histories are broken down into year ranges of 1987 through 1995 and 1996 to current date.
Level-1 Dopplergrams are computed from each pair of raw filtergrams on a per-minute basis. Each Dopplergram is a difference of the filtergrams in the sense of red - blue, and the difference is divided by the sum of the filtergrams to normalize the image. Likewise, a Total-Intensity image is simply the sum of the red and blue filtergrams. The purpose of the 60-Foot Solar Tower Project is to collect as many raw filtergrams for the computation of Level-1 Dopplergrams, by utilizing the 2-cell MOF. Unfortunately, two working filtercells were not always available because of their finite lifetime, and a limited amount of single-cell images were taken. By itself, a single cell has the affect of producing total-intensity images. This document is mainly concerned with the computation, conversion, and archiving of Level-1 Dopplergrams; the computation of total-intensity images is not being planned at this moment.
 |
 |
The Level-1 Dopplergrams consist of FITS files organized in directories containing all images observed within a given day. These data sets will be organized under dataset names prog:mwo,level:lev1,series:vel_01d[day-number], with an epoch for the day number started early enough to assure non-negative values in the archive; i.e. 1987.01.01_00:00:00_TAI. Individual files will be named uyymmdd.hhmm.fits, where yymmdd is the 6-digit year, month and day of the data set, and hhmm is the 4-digit hour and minute, corresponding to the nominal observation time.
The FITS record attached to each of the images contains the following keywords.
| KEYWORD | Definition | |
|---|---|---|
| SIMPLE | Mandatory. Conversion file type (T) | |
| BITPIX | Bits assigned to each pixel. Defined as 16 bits/pixel | |
| NAXIS | Mandatory. Defined as the number of axes in images (2) | |
| NAXIS1 | Mandatory. Defined as the number of pixels in x direction | |
| NAXIS2 | Mandatory. Defined as the number of pixels in y direction | |
| DATE | Date the image was taken, PST | |
| TIME | Time the image was taken, PST | |
| KTIME | Obs time in PST, 100ths of seconds that elapsed since Jan 1, 00PST. This is the start time of the Level-0 red-filtergram. | |
| K_MIN | Floating point minute since 00PST of the current day for the image | |
| STATUS | Observation Status, 100ths of seconds elapsed since Jan 1, 00PST. This is the start time of the Level-0 blue-filtergram. | |
| JULIANDA | The Julian Date for the current image | |
| DATASIGN | Sign Convention. Set to -1 for velocity data, which signifies that motion is in the redshift direction | |
| INTERVAL | Image integration time, in seconds (typically, 5.575). Two raw filtergram images (one red-shifted and one blue-shifted) are taken to compute each Dopplergram. The time separation of the start of these two images is 5 seconds. The integration time for each image is roughly 0.575 seconds. The INTERVAL is computed as the time separation of the original two filtergrams plus the integration time of the second image. | |
| IM_SCALE | Nominal pixel scale in arc-secs/pixel; Defined as OBS_R0 / 0.5*(FNDLMBMA+FNDLMBMI). Note, FNDLMBMA and FNDLMBMI are the mean values of the semi-major and semi-minor axes for the day. | |
| MA_SCALE | pixel scale along major axis for given minute, defined as OBS_R0 / ELLMAJOR | |
| MI_SCALE | pixel scale along minor axis for given minute, defined as OBS_R0 / ELLMINOR | |
| FNDLMBMA | Daily Average of major axis measured from Sun's center (pixels) | |
| FNDLMBMI | Daily Average of minor axis measured from Sun's center (pixels) | |
| FNDLMBAN | Daily Average Angle measured CW from the +Y axis to major axis | |
| ELLMAJOR | Major axis measured from Sun's center (pixels) for given minute | |
| ELLMINOR | Minor axis measured from Sun's center (pixels) for given minute | |
| ELLANGLE | Ellipse Angle for given minute, measured CW from the positive Y axis to major axis | |
| AVG_AREA | avg-daily area of the solar disk (pixels)^2; FNDLMBMA*FNDLMBMI*pi | |
| AREA | per-image area of the solar disk (pixels)^2; ELLMAJOR*ELLMINOR*pi | |
| R_SUN | Semi-major axis length of the apparent solar image (daily mean ) | |
| S_MAJOR | Scale for semi-major axis of non-circular images, for given minute | |
| S_MINOR | Scale for semi-minor axis of non-circular images, for given minute | |
| S_ANGLE | Position angle of S_MAJOR axis | |
| ORIENT | The orientation of the Sun's image indicating the "side" of the Sun that corresponds to the origin and x-axis used for the pointing and scale parameters. Typically, SESW Because of different cameras and changes in optical configuration throughout the course of this project, the orientation will change. | |
| X_SCALE | CCD pixels per bin. X{Y}_SCALE are the size of image elements in units of CCD pixels where the pixels are each of angular size, IM_SCALE. | |
| Y_SCALE | See XSCALE above | |
| XCEN | Location of the x center of the image array on the sun measured in arc-seconds from the center of the Sun's disk. Images are registered to the center of the chip array during computation of the Dopplergram. | |
| YCEN | Location of the y center of the image array on the sun measured in arc-seconds from the center of the Sun's disk. Images are registered to the center of the chip array during computation of the Dopplergram | |
| X0 | Distance along X axis to the central pixel of the solar disk (pixels) MDI starts counting at '0', so disk center is at 511.0 | |
| Y0 | Distance along Y axis to the central pixel of the solar disk (pixels) MDI starts counting at '0', so disk center is at 511.0 | |
| BUNIT | Physical Units of the data, in "meters/second" | |
| BZERO | Offset applied to true pixel values | |
| BSCALE | Scaling factor to convert integer type pixel elements of the image array to floating point type | |
| CALSLOPE | velocity calibration slope; constant for day. BSCALE/AREA | |
| INTEGDOP | Integrated doppler signal. The sum of all pixel values within the ellipse of the solar disk defined for that minute. | |
| VEL_DOP | Integrated doppler velocity; VEL_DOP = CALSLOPE*INTEGDOP + BZERO | |
| VEL_RES | Velocity residuals; VEL_DOP - OBS_VR | |
| VEL_RMS | Root Mean Square of daily velocity residuals | |
| LAT | Location of the observatory in degrees | |
| LON | Location of the observatory in degrees | |
| ORIGIN | Observatory where the telescope is located. (The Mount Wilson Observatory) | |
| TELESCOP | Name of the telescope used to take the images (60-Foot Solar Tower) | |
| INSTRUME | Type of instrument used; MOF (Magneto-Optical-Filter) | |
| DATE_OBS | Date and time of observation in UT. | |
| SOLAR_P0 | Solar Position-angle computed using 'solephem' software program, measured CCW (in degrees) from the +y-axis of the CCD array. | |
| SOLAR_P | Effective Solar Position-angle, measured CCW from +y-axis to N-pole. Angle is in degrees, and points to N-pole, taking into account the orientation of the coelostat mirrors. During the date range from roughly August 19 to April 30, of every year, the SOLAR_P angle makes a noticable jump of several degrees around 12PST, due to the change in coelostat mirror orientation. This mirror change is necessary as the Sun drops in declination to avoid a shadow from the second flat pier. | |
| DATAFILE | Name of the FITS image file. | |
| T_OBS | Actual (center of) observation time. Computed as INTERVAL/2 + "start time of first raw Level-0 filtergram" | |
| MININDEX | Number of whole minutes elapsed since 00PST. This value is the integer value of K_MIN | |
| OBS_B0 | Heliographic Latitude of the observer's disk center. Computed using 'solephem' | |
| OBS_L0 | Heliographic Longitude of the observer's disk center. Computed from 'solephem' | |
| OBS_R0 | Apparent semi-diameter of Sun in arc seconds. Computed from 'solephem' | |
| OBS_DIST | Sun-Earth Distance (AU). Computed from 'solephem' | |
| XSCALE | XSCALE = X_SCALE * IM_SCALE | |
| YSCALE | YSCALE = Y_SCALE * IM_SCALE | |
| OBS_VR | Radial velocity of observer in m/s. Positive direction is toward the Sun. This value is the sum of the geocentric + barycentric velocities relative to the observer. | |
| OBS_VRHC | Heliocentric radial velocity in m/s. Positive direction is toward the Sun. This value is the sum of the geocentric + heliocentric velocities relative to the observer. | |
| QUALITY | Status summary. Scale runs from 0 - 10. This value is determined by 'sigma = int(VEL_RES/VEL_RMS)'. If 'sigma' is 3 standard deviations or less, the QUALITY value is '0' and the image is clean and sharp. If 3sigma < VEL_RES <= 4sigma , QUALITY = 3 If 4sigma < VEL_RES <= 5sigma , QUALITY = 4 If 5sigma < VEL_RES <= 6sigma , QUALITY = 5, etc. If VEL_RES > 10sigma , QUALITY = 10 Values of 4 and 5 are often times still acceptable for spherical harmonic decompostion, but can vary from day to day, so should not assumed as a given. | |
| END | ||
The following keywords will be included in FITS records in all other years except for 1996;
| KEYWORD | Definition | |
|---|---|---|
| CADENCE | interval between measurements of computed Dopplergrams (60 secs) | |
| CENTER_X | Center of solar disk along x-axis assuming origin starts at a count of 1; defined as X0 + 1 | |
| CENTER_Y | Center of solar disk along x-axis assuming origin starts at a count of 1; defined as X0 + 1 | |
| OBS_TYPE | Cell operation status. There are two possible types based on observing in MOF mode (two cells) 'DOPPL '; observing in INT mode (one cell ) 'INTEN ' | |
| OBS_VN | northward velocity of Sun with respect to earth | |
| OBS_VW | westward velocity of Sun | |
| FILTER | filter selection status; sodium (Na) or potassium (K) | |
| CAMERA | camera selection status; a total of four different cameras have been used in the course of this project, 3 hi-res and 1 low-res: 'JPL ' 1024x1024 native resolution built and designed at JPL In use from 1987 through 1991. 'JPL-TALK ' 1024x1024 native resolution with board set designed by Doug Triman at Talktronics Inc., and assembled at JPL In use from mid-1993 to present, with break in early 1994 for testing 'TALKTRONICS' 1024x1024 native resolution built by Talktronics Inc. Secondary camera used in late 2002 for testing purposes. 'PANASONIC ' 492x512 native resolution with rows padded to 512x512 array; 30Hz analog aquisition In use from 1992 through 1994 as temporary replacement for "JPL" camera | |