

Click on an image for a larger ".gif" file. The postscript files are all compressed.
During the summer, while SOHO was possible not recoverable, NASA considered putting SOHO replacement instruments on the Triana mission. A proposal was made for a version of MDI on Triana. This proposal contains a summary of accomplishments in the SOHO base mission and expectations for the extended mission. The MDI_T proposal is available.
During the first two years of SOHO and the first half year of TRACE we learned the desired characteristics of a future mission to be able to better exploit the capabilities developed with SOI and to better study the processes important in the development of solar activity. We proposed a mission, Hale, as a MIDEX to accomplish these ends. The MIDEX selections will be announced in early 1999.
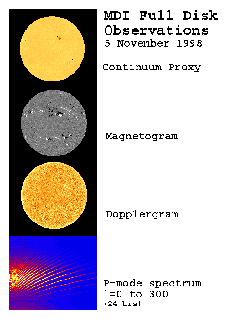
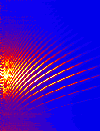
Some summary images were prepared from data obtained on 5 November demonstrating that MDI was again functioning normally. These summary plots are:
On 21 December 1998 during a normal momentum management procedure the third and final spacecraft gyro malfunctioned. While the spacecraft was put into a safe hold mode, no observations were possible until TBD.
Analysis of data from the first 26 months of the mission proceeded during the SOHO summer and winter interruptions. Some of the results are seen here.
MDI recommissioning images from Nov 5, 1998. Images are available both in a combined format and individually.
MDI recommissioning images from Nov 5, 1998.
Images are available both in a combined format and individually.
Time-Distance methods provide a method to infer sound-speed variations and flows in the interior. This view shows sound speed variations beneath a sunspot. The spot was observed in June 1998 just prior to the SOHO 4-month interruption. This image was used on the group Christmas card with the following text:
"An image of the sound speed below a sunspot derived from dopplergrams observed with the Michelson Doppler Imager onboard the Solar and Heliospheric Observatory spacecraft using the technique of time-distance helioseismology. Three planes are shown, on top the intensity at the surface which shows the sunspot with the dark central umbra surrounded by the somewhat brighter, filamentary penumbra. The second plane is a vertical cut from the surface to a depth of 24000 km showing areas of faster sound speed as reddish colors and slower sound speed as bluish colors. The sound speed is affected both by the temperature of the gas and the magnetic field, which we know to be strong in the sunspot at the surface. The normal increase of sound speed with depth in the sun has been subtracted so that we are only looking at deviations from the average. The third plane (bottom) is a horizontal cut at a depth of 22000 km showing the horizontal variation of sound speed over a region of 150000x150000 km."The Time-Distance method is fully described in a preprint. The image was rendered with a local version of the vis5d program.