|
|
|
In March 2000 the SOHO/MDI science team announced the first images of an active region on the far side of the Sun. (see March 2000 announcement) Since mid 2001 these far side images of the central area of the back side of the Sun have been prepared for each 12-hours and made available on the web. Also in that year a technique was shown that could provide sensitivity for the whole farside rather than just the central area possible with the original method. The new method was slow to compute and the transition between the central and surrounding regions was not smooth enough to make the method useful as it was. (See Braun 2001). The MDI team now announces availability of a full set of far side images of solar activity resulting from an improved analysis technique that reveals the entire far side of the Sun rather than just a region on the center of the side opposite the Earth.
|
Active regions are the centers of energetic phenomena such as sunspots, solar flares and coronal
mass ejections whose resulting electromagnetic and particle radiation interfere
with telecommunications and power transmission on Earth and can pose significant
hazards to astronauts and spacecraft. Active regions, typically Earth-sized, are regions
on the visible surface of the Sun containing strong magnetic fields in complex
configurations. (Remember the Sun is about 109 Earth diameters across.) Since
the Sun rotates on its axis in about 27 days, regions facing the Earth rotate
off the visible surface after at most 13 days. They can emerge at any longitude
so can suprise solar observers if they form on the back side of the Sun and
rotate into view as already very active centers. This happened in October 2003
when some of the largest active regions containing some of the largest sunspots
of the present cycle appeared coming over the east limb of the Sun - already
spreading X-rays, extreme ultra violet radiation, high energy particles, and
coronal mass ejections into interplanetary space. That time we had a warning since
the regions were seen on the far side of the Sun with seismic holography.
However, we were not able to make a public prediction because the original
farside method could only detect regions centered on the back side.
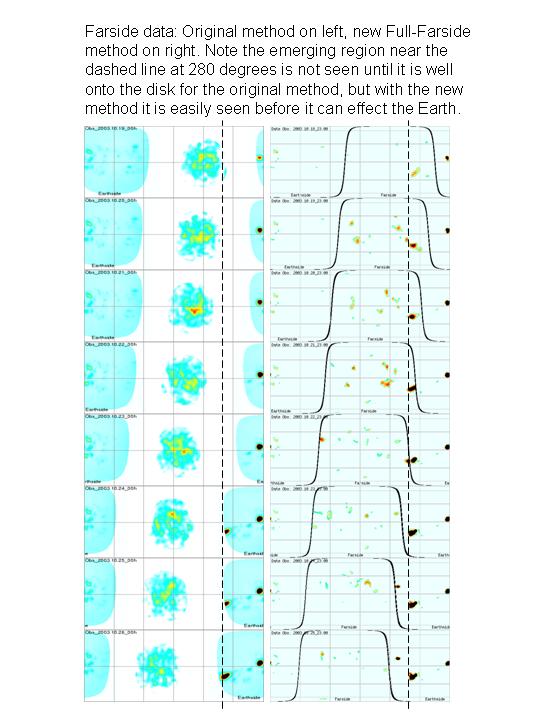
The new method is an extension and improvement to the original method. By combining the original method of using the travel time of sound waves which bounced once from the underside of the surface going to and coming from each location on the farside, with a new method that uses a 1-bounce + 3-bounce combination we are now able to see regions rotate right up to the visible limb and move onto the front side where they can be seen by numerous methods. Both the original and the new methods are subject to some random noise which can look like active regions. One of the reasons that the new method is more useful is that by following a region for several days one can determine if it is real or just some observational noise. We are after all looking through a star with sound waves! It is not at all suprising that sometimes the view is a bit indistinct. Because it is so helpful to watch the evolution of regions, the data is best viewed with the aid of a graphics viewer where one can select a time interval of interest and watch the Sun in a time-loop. While we are still developing this viewer, it is already useful (Feb 2006) and is linked to the top of the farside data page, as well as here. Farside Graphical Viewer. |
|
The following images and collections of images on linked pages contain some example images, movies, and comparisons of the old and new methods. Some images of motion on the visible solar surface are also included to see what the observed data looks like before it is turned into farside images.
In the images seen on these pages we show the active regions "seen" on the far side of the Sun on a "cylindrical equal area" projection. I.e. on a flat map. We show magnetic flux observed on the front side. The magnetic flux is the amount of magnetic field in each small region. This shows the locations of sunspots and active regions. Since the front and far sides are both showing a measure of magnetic activity we use the same colors for both. A light blue for regions of little or no magnetic activity and a darker color tending to dark orange for regions of strong activity.
The horizontal grid lines shown on these maps show the solar equator and 30 and 60 degrees north and south. The vertical lines are drawn each 60 degrees of longitude. The edges of the maps are at Carrington 0 and 360 degrees. (Carrington longitudes are just a way of labelling locations on the rotating Sun and were defined by Lord Carrington in 1854). As the Sun rotates the part of the Sun facing the Earth shifts to the left in this format.
See also: |
The NASA Press Release Site |
The ESA Press Release |
|
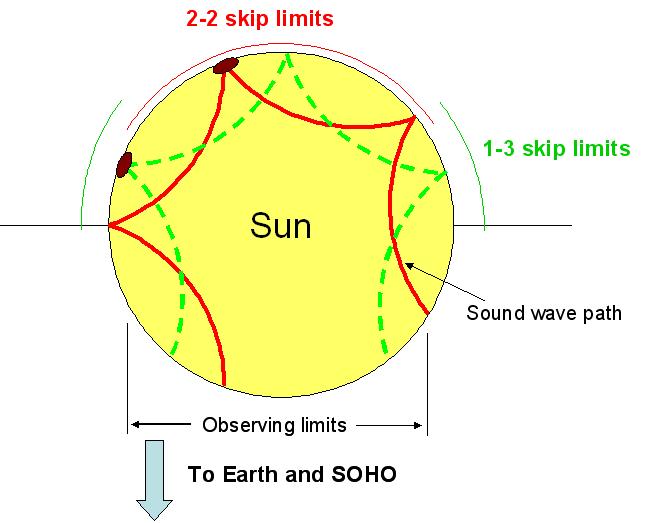
This diagram shows some sample sound wave paths connecting the front or Earth side of the Sun with the back or far side. Sound waves are generated by the small scale (California size) convection at the visible solar surface. When these convection cells called "granules" cool and fall back into the interior they cause sound waves to move into the Sun in all directions. There are about 7000 such wave sources going off each second. This diagram shows the path of some of the waves from one of these starting on the front side. As the waves move into the Sun they get refracted (bent out) back to the surface because the sound speed is higher deeper into the Sun. When they get to the surface (visible layer, photosphere) they bet reflected back into the Sun. When they get reflected the visible layer recoils (moves) and we are able to measure that movement. |
| The short movie on the right shows a sequence of "Dopplergrams" - maps of motion made by observing the Doppler effect. Light areas are moving up and darler areas are moving down. The region shown is about 1/6 the diameter of the Sun wide. The motions oscillate with a period of about 5 minutes. (2.1meg MPEG) |
|
|
Because the sound speed beneath active regions is a bit faster than
other places and because the reflecting layer beneath active regions
is a bit deeper than other places, waves that include an active
region at one of their bounce places will return to the front side
a bit sooner than other waves.
In the original method we examined only waves that left the front side, bounced once then bounced from a target location then bounced again on the way returning to the front side where we can see them again. We measure the difference in round trip travel time from the average round trip travel time. If an active region was in the path the waves get back about 20 seconds sooner than the c. 5-hour average time. We add up all the waves targetting each far side location together in such a way that we can focus on each location one at a time. We do this for each far side location that we can "see" in the two bounce paths to make the far side map. We call these "2x2" maps and with this method we can only "see" the center part of the far side. For the new method we also compute a map for the annular region between the limb and about 40 degrees from the far side center. This can be done by measuring waves that are focused after one bounce and take three bounces to get back to the front - and of course waves that are focused after three bounces and take one more to get back to the front. By combining the 2x2 old way, and the 1x3 and 3x1 waves we obtain a map of the full farside. One of the important new steps in the process is to correctly remove the background average trend separately for the 2x2 region and the 1x3 regions allowing an overlap area to smooth the transition from one kind of map to the other. (This and some spatial smoothing is now done independently for the sine and cosine components of the signal before combining to determine the phase delay, travel time difference, that is the actual signal shown.) To do this we now use 34 hours of surface motion maps, with one map for each minute (formerly 24 hours). Each of these 2048 maps contains about 30,000 measurements. The computation for each farside map takes about 2.5 hours on a fast computer. About 1.6 "processor years" were needed to process the data from the beginning of the SOHO mission up to the present time. |
|
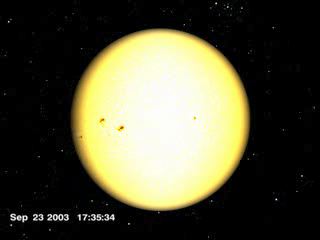
| In order to see the benefit of farside imaging of the Sun these images show the Sun on 22 October and 24 October 2003. The limb darkening has been removed by increasing the brightness toward the limb - this allows a better view of sunspots as they appear near the limb. It can be seen that a large region rotated onto the disk between these two dates. Click on these to see the full resolution MDI images. | |
|
|
| The farside processed images below show the entire Sun for the same two dates. Note that on the 22nd of October the large region can be seen before it rotates onto the front side of the Sun. | |
|
|
|
|
|
|
|
The movie on the left shows the time around the "Halloween Flares" of 2003. In late October 2003 some very large active regions emerged - some on the far side and some on the front side - which contained some of the largest sunspots of the present cycle and which generated the largest flare of the cycle. The movie starts with the Sun as observed in white light - showing the sunspots rotating by. Then the viewer apparently "moves" to the left, around the east limb of the Sun, to peak at the far-side heliosiesmic activity maps. The movie shows regions coming from the back side and rotating onto the front side. (1.0meg Quicktime) (Credit NASA, Tom Bridgeman). |
|
This image shows Active Regions 10507 and 10508 crossing the solar east limb
in November 2003. These are the same regions that were called 10488 and
10486 in the previous rotation when they were the source of large flares.
The right side, in yellow, are white light images showing sunspots. The left side (blue) is the farside magnetic flux proxy data. Since the white light observations are images made "straight on" when they are projected to show the view over the limb they are stretched into blury lines. This is simply because we do not have a camera above the East limb (yet).
|
|
|
|
|
|
Hathaway pealogram of near and far surfaces of the Sun. D. Hathaway of
NASA/Marshall invented this clever technique to illustrate the geometry
of longitude-latitude maps that render both near and far surfaces of the
Sun in a single view. The viewer can imagine the surface of the Sun being
pealed off and spread across a rectangular frame as the Sun rolls from
right to left across the field of view. The resulting rectangular map shows
the Sun's surface as approximately stationary with respect to individual
active regions. As the Sun rotates from east to west, individual active
regions remain approximately in place on the map while the half of the
Sun facing towards the earth slides from west (right) to east (left). While
this is happening active regions appear at the surface and, like terrestrial
storms, grow and undergo violent seizures, venting off with flares and
coronal mass ejections before they decay and disappear. Nearly half
of the large active regions we see from earth rotate into view after being
born on the far surface of the Sun. (From C. Lindsey)
This sequence starts with the Sun as seen in white light but with the darkening toward the limb removed. The start date is September 15, 2003 just a month before the large active regions. The white-light Sun is replaced by images showing the magnetic flux which can be seen to be strong in regions with sunspots. Next the magnetic image is pealed off the sphere and presented as a flat map. Finally latitude, longitude, and the limb lines are added and the map is allowed to change with time until the regions grow, rotate across the Earth side and decay in early December. Select movie type to start the movie.
|
|
|
Quicktime movie, (1.6meg) AVI movie, (2.2meg) |
|
|
|
| The farside data for this time can also be seen as a movie of the solar maps showing the whole Sun on a flat map. These show the "farside" images and the Earthside of the Sun magnetic flux data. The "limb" is also shown as the black line between the front and back sides. The line is curved becasue the Sun's rotation axis is tipped compared to the orbit of the Earth. As the Earth moves in its orbit the direction of this tip changes as seen from the Earth or SOHO which is near the Earth. (4.2meg MPEG) |
|

|
The above movie depicts a non-rotating Sun showing the side of the Sun facing the Earth. For comparison to the above format, the movie to the left shows a non-rotating movie of the Earth showing the side of the Earth facing the Sun. (3.7meg MPEG) (Images from www.time.gov) |
Why show October 2003?
The active regions that crossed the Sun's Earth-facing side in October and November 2003 were some of the most active recorded. They generated large flares knows to solar observers as the "Halloween Flares". They generated scientific and public interest at the time and continue to be studied. For contemporary reports see the SOHO "Hotshots" pages at:
20 November 2003
4 November 2003
28 October 2003
22 October 2003
More Information about farside imaging of the Sun.
For links to additional descriptive information about the farside method see the GONG farside pages maintained by the National Solar Observatory Global Oscillations Netowrk Group.
For more discussion on the method also see Doug Braun's pages where there are links to the published scientific papers describing the method.
|