
There was a long-awaited M-class flare on 2-Apr-99.
Around this flare, which came from the east limb, SXT images showed an
eruptive event on the northwest limb. Both AR 8498 and AR 8497 (closer
to the limb) brightened. Click the following image for a
MPEG movie of the eruption (37 kbytes).
Note that AR 8497 assumed a nice ``sigmoid'' appearance a couple of days before.
In last week's nugget, we mentioned potential difficulty of identifying signatures of a coronal mass ejection (CME) in SXT images. It has been known for long that a CME can occur away from active regions marked by sunspots, but some CMEs are clearly associated with flares, phenomena seen only in active regions. A large number of CME-associated flares are long duration events (LDEs) that characteristically involve cusp geometry. Irrespective of the presence of cusp, SXT time sequence images of flares occasionally show ejecta, which might or might not represent a lower part of a CME, even from relatively short duration events. See Shibata et al. (1995) in ApJ Letters, who wrote emphatically that all these (eight) flares were associated with X-ray plasma ejections high above the soft X-ray loop. On the other hand, we empirically know that some flares do not show any ejection at all in SXT images. Similarly, it is well known that the correlation between flares and CMEs is quite poor, implying that only certain types of flares have CME connections. Therefore we would like to find out if the presence of X-ray ejection has anything to do with the relation between flares and CMEs. But before reaching any meaningful conclusions, we need to make sure that some flares indeed lack X-ray ejection, since various observing conditions could prevent the ejection from being detectable.
Click the following image for a movie showing X-ray ejection in a small
flare at N03W67 (20-Apr-96, 07 UT) which was observed in non-flare (quiet)
sequence. The cadence is 50-60 seconds.
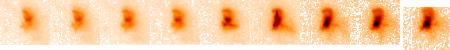
Note that the primary ejection is fast and directed toward southwest, but that loops north of the central flare also appear to rise slowly.
Although this is still preliminary, we try to estimate the background level that affects the detectability of the ejection. We calculate the model background of a given image from interpolating only non-flare pixels. We determine the background at the position of the ejection using the fluctuation in the model. In the following plot, we show light curves for the flare (red), the ejection (blue), the average background (square), and 3 x the fluctuation (line). It is clear that the main contributor to the background is the flare itself, when the projected location of the ejection is not far away from it.
The following plot shows how the flares with and without X-ray ejections are distibuted in solar longitude. Even though there is no clear correlation of the background level with the longitude, more events with X-ray ejections are actually close to the limb. This may imply that an ejection coincides with the direction of the line of sight in disk events.
4 April 1999: Sachiko Akiyama (akiyama@flare2.solar.isas.ac.jp), Nariaki Nitta (nitta@lmsal.com)