
Emergence of magnetic field at the solar surface takes the form of a small bipole. X-ray images often show large-scale loops, but these should not represent the scales on which they emerged. Rather, they are considered to result from magnetic reconnection. It is also unlikely that a loop crossing the equator emerges as such, because magnetic field emerges independently in the northern and southern hemispheres, according to dynamo theory. Such trans-equatorial loops were actually discovered by Skylab more than 20 years ago. Yohkoh observations with much higher cadence reveal their dynamical nature. A beautiful example was already shown in a previous nugget.
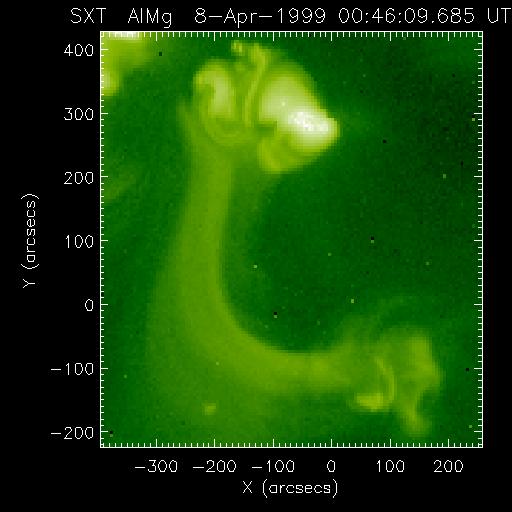
The following image (click to enlarge) was taken on 8 April 1999, on
which a loop is clearly seen to cross the equator (near disk center). Unlike
the example presented in the previous nugget, this loop or loop structure
was not clearly seen at the east limb.
The northern leg of this loop seems to be anchored at AR 8507, which is a so-called `` anemone region.'' See Shibata et al. (1994) for a typical anemone region. The area at which the southern leg is anchored does not correspond to a numbered region.
In the following figures, we locate the loop on to photospheric magnetic
features as observed at Kitt Peak. The left panel shows a magnetogram taken
at 7-APR-99 14:52 UT (ignore the label attached to the figure), rotated
to the time of the X-ray image in the middle. The magnetogram in the right
panel was taken at 8-APR-99 16:50 UT.
 |
 |
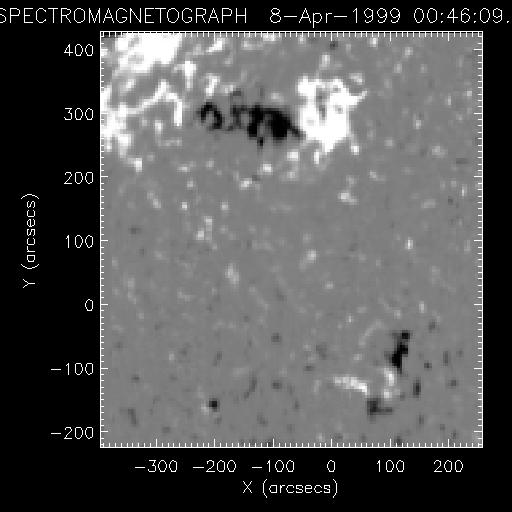 |
Despite the ambiguity in locating the real footpoints in SXT images (because of the lack of sensitivity at low temperatures), it appears that the northern footpoint of the bright loop corresponds to S (black) polarity. The matching N (white) polarity at the southern footpoint is not easily identified, because N and S polarities are not aligned in a simple way. This alignment may represent cancelling magnetic features, but the area did not change over one day, according to the left and right panels. In addition, there seems to be another diffuse loop whose northern leg goes slightly west of the clear loop, to N polarity. Therefore we have a set of nearly oppositely directed loops, but their 3-d geometry is hard to infer -- there is a slight indication of an X pattern a day later, which is expected from reconnection theory, but its relation with the loops is not unknown.
The trans-equatorial loops show interesting characteristics in a movie
presentation. Click the following image for a movie that shows time-sequence
images of SXT in AlMg filter (left) and SoHO/EIT in Fe XII (1.6 MK) line
(right).
First, except for dynamic behaviors of the southern footpoint, the loops hardly show presence in the EIT images. This indicates that the loops are hot, probably above 2-3 MK. Second, the loops show clear contraction.
A similar example of loop contraction was shown by Wang et al. (1997) for loops within an active region. It was suggested that cancelling magnetic field at the loop footpoint(s) play an important role in the dynamics of the loops. If we consider the contraction to result from reconnection, i.e., a transition of initially cusp-shaped field lines to a closed structure, does every active region loop go through the same process to be visible in X-rays? We have to remember that contracting loops are much less common than expanding loops as far as SXT data are concerned.