As readers of these nuggets know well, the SXT soft X-ray images are either FFI's (full-frame) or PFI's (partial-frame). The latter are small, and they may or may not be watching the right place to catch a flare that's about to occur. Yohkoh's normal mode of operation ("ARS1" for Active Region Search, mode 1) simply puts the partial-frame images on the brightest region as judged on-board in real time (updated typically every ten minutes). Sometimes this region flares, sometimes it doesn't. This nugget asks the key question: "How well does the brightness of an active region predict flare occurrence?"
The plot on the right below shows typical results of this "hunting around," relative to the image on the left. The faint circle shows the limb of the Sun, and the squares show where exposure time has accumulated in the PFIs for a day or so. The fact that several regions have coverage just means that they are flickering with microflares, and that they take turns being brightest at the time of the pointing updates.
It is clear that active-region brightness and flaring are related. For one thing, flares are bright. Secondly, if there were only one active region on the disk at a time, it's almost certain to be the location of the next flare. This latter line of reasoning would suggest that during solar minimum ARS1 would score well, whereas in solar maximum it might not. So it is not surprising that the coverage map above should look like a coarsely represented image.
Now, with eight years of Yohkoh data safely tucked away, we can do a retrospective look at how well the ARS1 operating mode worked. The tabulation of statistics on this question reveals the following interesting things:
We often are asked where the next flare is going to happen. We now know that it's like the weather: tomorrow's weather is likely to be like today's; tomorrow's hot active region is also likely to be today's.
The great success we have had in tracking flare-productive active regions leads immediately to some important physical questions. For example, is there a particular physical state in an active region that causes a flare? Is there a "pre-heating", to quote an idea that simple-minded theorists have often assumed? Or, is there a loop-loop interaction driving reconnection to cause a flare, another favorite figment of theorists' fervid imaginations? In principle we could just look at these data and see what was there (typically at an interval of a few tens of seconds) prior to the flare trigger.
Let us see how this looks in practice. Here is the last entry in the statistical survey:
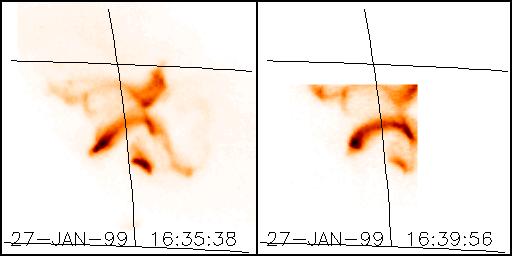
The light curve at the bottom shows the times of the two images, one ostensibly a "flare" image, and one a "preflare" image. In fact both are from the flare process itself, as shown by the gradual rise in the GOES light curve prior to either image; the flare trigger just set itself at an arbitrary threshold during this process. So in this case the naive statistics perhaps weren't so good; the "preflare" data that attracted Yohkoh's attention may have been already the flare itself.
Scientifically, however, this is all to the good. We are seeing interesting things. Even though there have been one or two papers from Yohkoh on this subject, they have not yet been decisive in clearing up confusion about the very existence of observable preflare states. But it is a subject worth much more study. In these interesting times, full of sigmoids, bald patches, and now the FlareGenesis balloon flight, we have a good chance to make real progress.