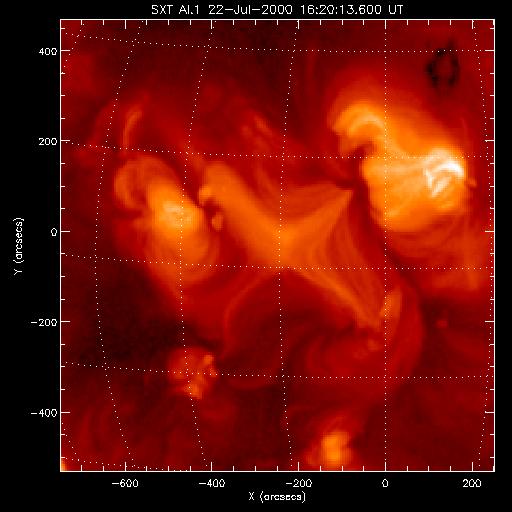
The next figures provide zoom-up views of the region (click each of them to enlarge). They are (from left to right) SXT (Al.1 filter), MDI and EIT (195 Å). The SXT image reminds us of the shape of magnetic field lines near the diffusion region in a 2-d reconnection model. Of course, this is only an impression, since the loops must have 3-d structures, sticking out of the image plane. Moreover, it is not clear which ones represent incoming fields and which ones represent those driven out after the reconnection.
 |
 |
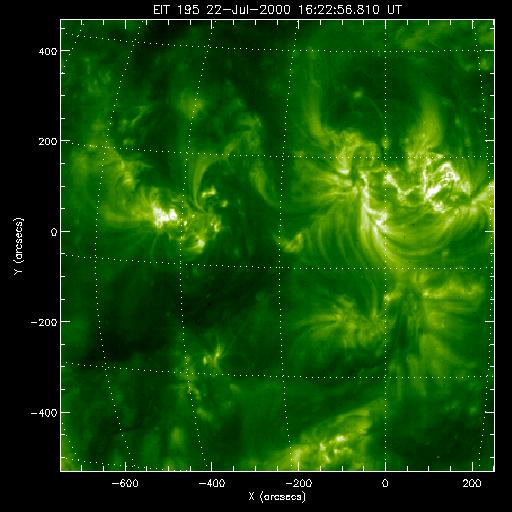 |
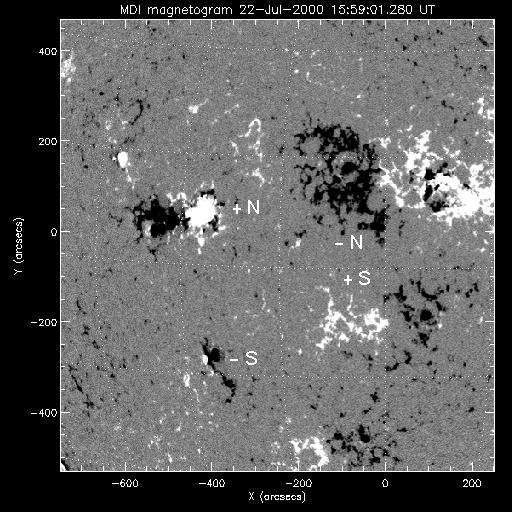
The middle figure gives us a hint as to where the loops are anchored. Remember, SXT does not show the loop footpoints, because it is not sensitive to temperatures below 1-2 MK. So locating the footpoints on a photospheric magnetogram such as the middle figure is always tricky. Please try to guess the footpoints of the loops that form the X shape, by remembering that they have to connect different polarities (between white areas such as +N and black areas such as -S). Note that the loops that form the X are already reconnected loops, not representing the original bipoles as they emerge. For example, the +N emerged with the negative (black) area to the east, and the partner of -S should be the small positive (white) area to the east. The right figure simply shows that the loops that formed the X did not show up in the EUV images that are sensitive to temperature of 1-2 MK, indicating that the loops are hotter than this range.
The movie shows the evolution of the X pattern. It appears that the part running east-west became faint by 23-Jul-00 02 UT. Note added in proof: Alas we can't bring you these movies here; please refer to the original nugget pages. The next movie shows EIT 195 Å images. The area corresponding to the X pattern is essentially featureless. Loops reminiscent of the X pattern appear only around 23-Jul-00 00 UT, possibly representing the cooling signatures of the X-ray loops that formed the X pattern. Note added in proof: Alas we can't bring you these movies here; please refer to the original nugget pages.
September 22nd, 2000