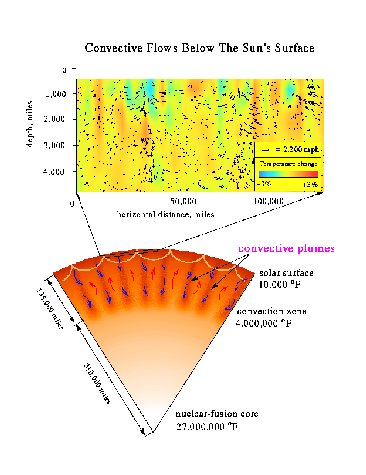
Tomographic inversion by A.G. Kosovichev was applied to infer the sound speed and velocity flows from the time-distance maps generated by T.L. Duvall.
In the figure below, the top graphic is a vertical cut showing velocity and temperature variations below the solar surface derived by time-distance (travel) helioseismology. The arrows indicate the direction and magnitude of the flow. The red and blue coloring indicates the variations of temperature, with red being hotter, and blue coller. The bottom picture shows that the upper vertical cut is from a thin shell in the outer solar convection zone, which encompasses the outer 30% of the Sun.

You may download this figure as a postscript file. This inversion was presented at the AAS-SPD meeting in Madison in June 1996.
You can find more about this result from the the
preprint, (5.4Mb,postscript) titled:
Time-Distance Helioseismology with the MDI
Instrument: Initial Results, by
T.L. Duvall, Jr.,
A.G. Kosovichev, P.H. Scherrer, R.S. Bogart, R.I. Bush, C. DeForest,
J.T. Hoeksema, J. Schou, J.L.R. Saba, T.D. Tarbell, A.M. Title,
C.J. Wolfson, and P.N. Milford.