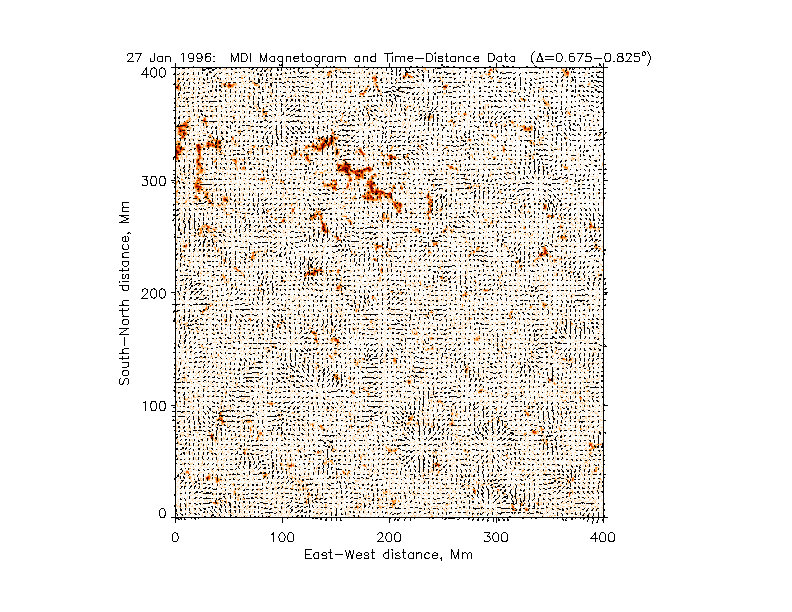
This result is a comparison between the absolute value of magnetic field (background in color) and the simulated velocity inferred from Time-Distance helioseismology. The arrows signify horizontal (convective) motion at the surface of the Sun. The longest arrow represent 1 km/sec velocity.

You can also download a postscript version of the above figure.
You can find more about this result from the the
preprint, (5.4Mb,postscript) titled:
Time-Distance Helioseismology with the MDI
Instrument: Initial Results, by
T.L. Duvall, Jr.,
A.G. Kosovichev, P.H. Scherrer, R.S. Bogart, R.I. Bush, C. DeForest,
J.T. Hoeksema, J. Schou, J.L.R. Saba, T.D. Tarbell, A.M. Title,
C.J. Wolfson, and P.N. Milford.