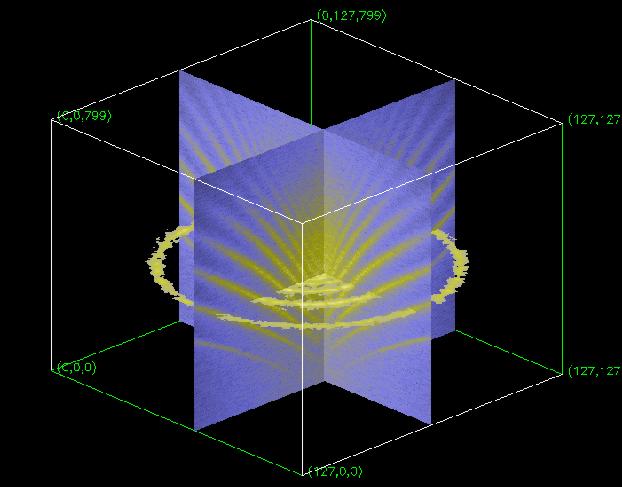
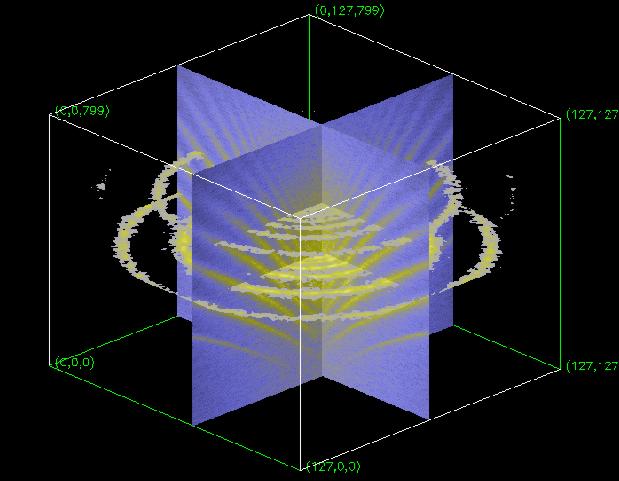
For solar oscillations, the power is not evenly distributed in the k-omega plane, but instead corresponds to ridges. Each of these ridges corresponds to a fixed number of wave nodes in the radial direction. The ridges are seen here as "rays" in the cut planes facing you.
The rings that you see cut out of the z-axis plane are 3D representations of the p-mode ridges. Six rings equal six modes. Eight rings equal eight p-modes, and so on. The frequency value of the top of the z plane is the Nyquist frequency, the high-frequency limit given by the time resolution of the signal, which here is 8334 microHz. The densest part of the ridge pattern is roughly 3000 microHz. The frequency resolution is 5.71 microHz.
This data was acquired by the Michelson Doppler Imager instrument on board the SOHO spacecraft in June 1996. Data and guidance: Phil Scherrer, Rick Bogart, Jesper Schou, Sasha Kosovichev, and Tom Duvall. The 3D power spectrum data set was generated by Rick Bogart, prepared by Amara Graps into this 3D representation, and presented by Rick Bogart at the "Sounding Solar and Stellar Interiors, IAU Symposium No. 181," Nice, France, 30 September -- 3 October, 1996.
You can also download a postscript version of the above figure.
 SOHO SOI/MDI Results.
![]() The SOI Main Page.
The SOI Main Page.