

The TRACE images may be used without restrictions
in publications of any kind. We
appreciate an acknowledgement indicating that
the Transition Region and Coronal Explorer, TRACE,
is a mission of the Stanford-Lockheed Institute for Space
Research, and part of the NASA Small Explorer program. More information on
TRACE and other TRACE images can be found
here.
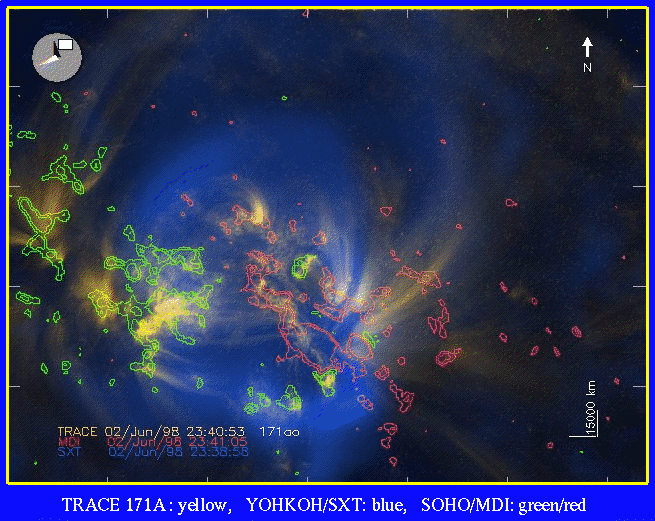 |
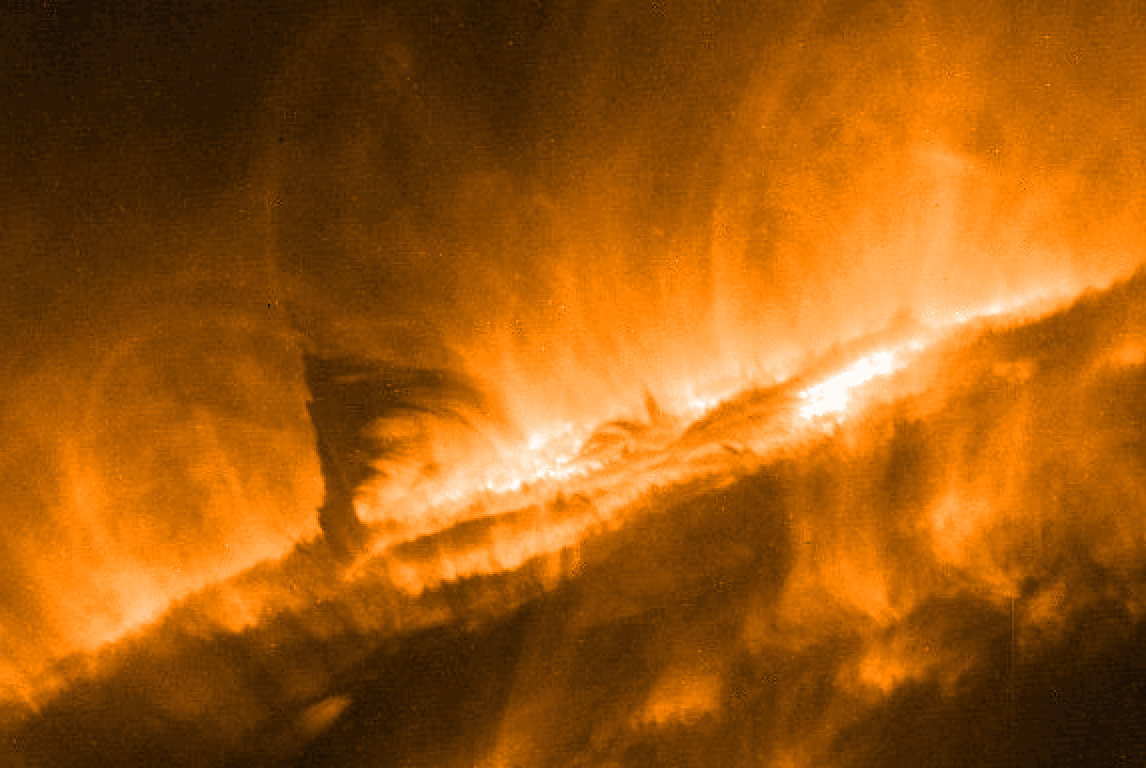
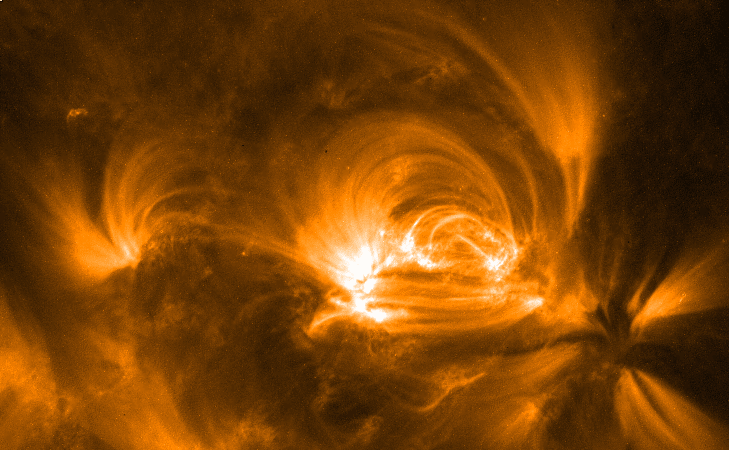
A composite of three different images
(02 June 1998; 23:40UT). The red and green contours show the locations of
the most intense magnetic fields on the solar surface as observed with
SOHO/MDI. The yellow image is the TRACE 171Å image, which shows gas at
approximately 1 million degrees. The high-arching coronal loops, starting
generally at the outer edges of the active region, are roughly 1 million
degrees along their entire length. In the interior of the region, however,
the 1-million-degree plasma is restricted to the low-lying ``mossy'' emission
that largely overlies the strong magnetic fields. Above it, the core of
the active-region corona is much hotter, typically 3-5 million degrees, which
emits X-rays, shown in blue, as observed with YOHKOH/SXT. The location of
the region on the Sun is shown on the clock face in the upper-left corner;
the scale is shown in the lower-right corner.
|
 |
These images were taken by TRACE on 28 June 2000 at 06 UT.
Active Region 9046 is
shown in the 195Å passband and the 1600Å passband. The image in 195 A
represents emission at 1.5 million degrees. The 1600 A image shows
emission from the surface temperature at ~5000 degrees up to
100,000 degrees. Courtesy: Dawn Myers.
|
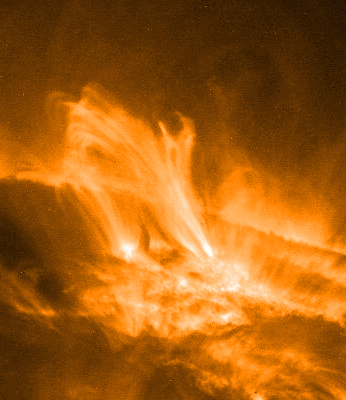 |
A rainy day on the Sun! This TRACE movie,
taken on 30 June 2000, from 15UT to 16:30UT in the 195Å passband
(1.5 million degrees) shows coronal loops cooling rapidly. The loops
are initially at a temperature of around 3 million degrees, when they are
not visible to TRACE. As they cool, the become bright at the TRACE
wavelength; as their temperature drops below 1 million degrees, they
rapidly fade again. But the material continues to cool: the dark blobs
sliding down the loops (known as coronal rain) are so cool (probably
well below 100,000 degrees) that enough non-ionized hydrogen exists to
cause the EUV light to be extinguished. So very close to another,
the temperatures in the corona range over a factor of close to one
hundred! Look
at the 1.8MB
to see the cool material
slide down the magnetic field, pulled down by the strong solar gravity.
|
 |
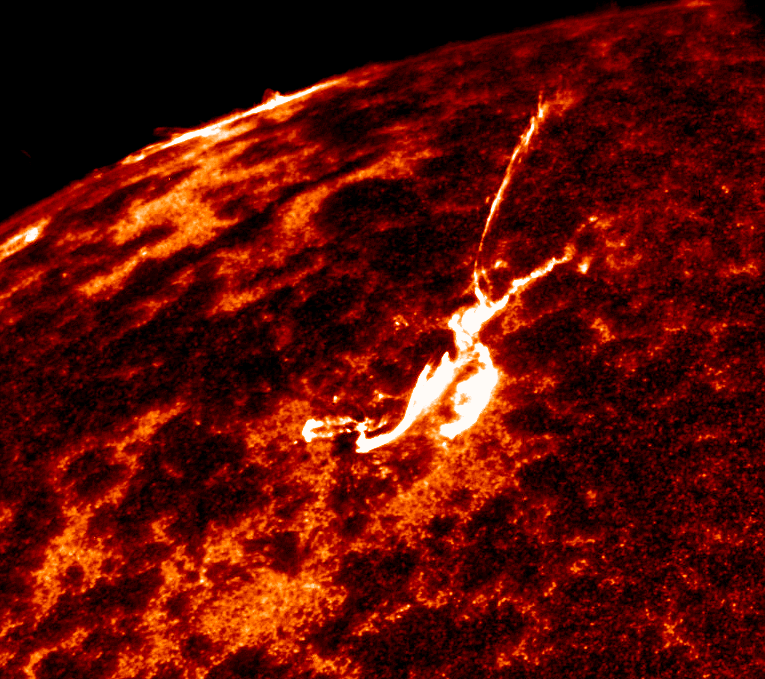
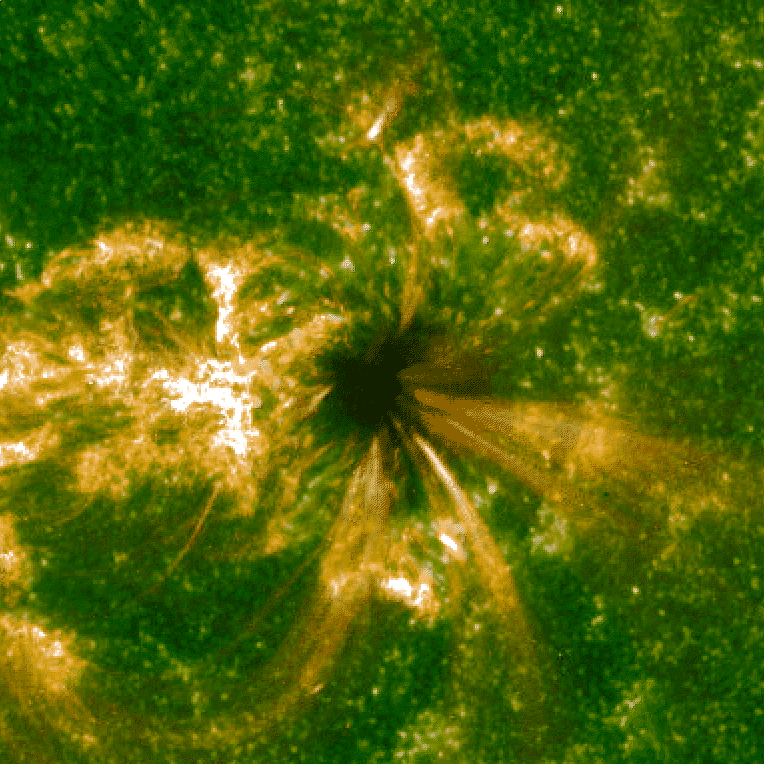
This image of Active Region 9046 was taken by TRACE in the 195Å
passband (showing the emission of 1.5 million degree gas) on
27 June 2000. The image was rotated over 90 degrees, placing North to
the left. The region shows an unusual filament/prominence in absorption,
with matter being spewed out to the right in downward arcing strands.
|
 |
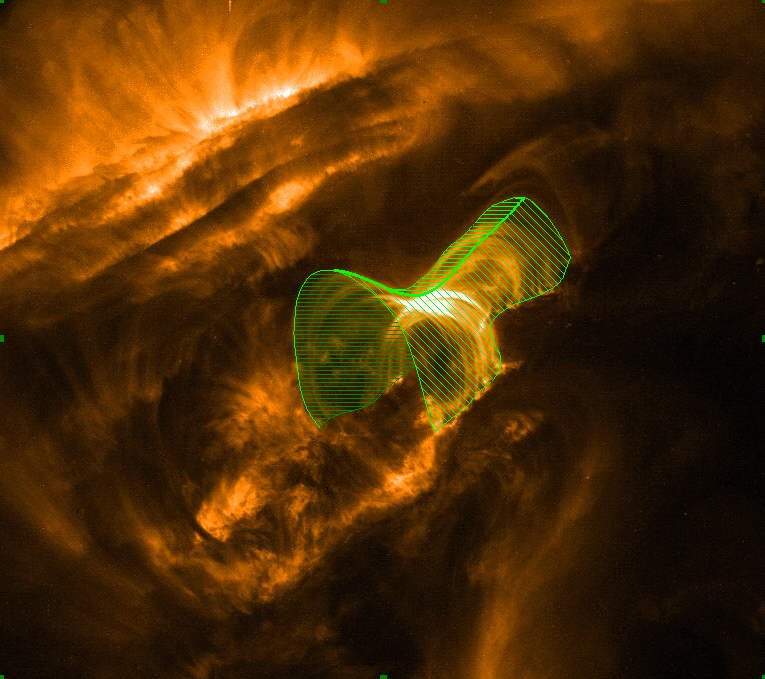 |
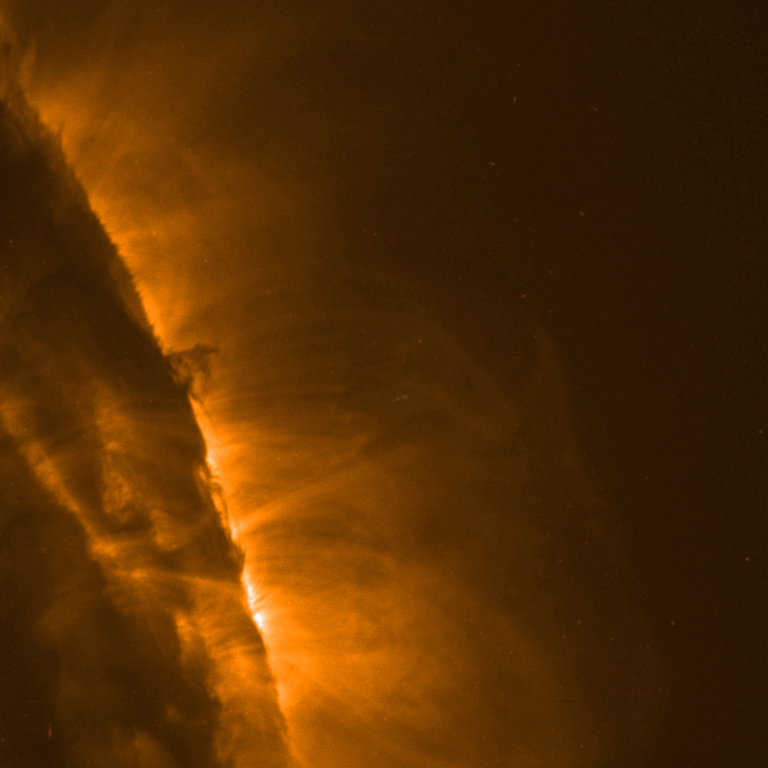
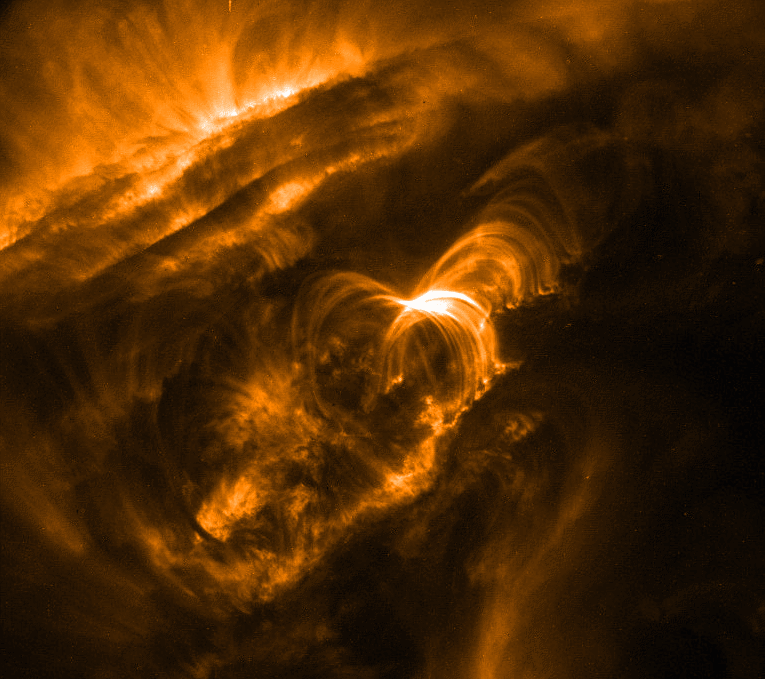
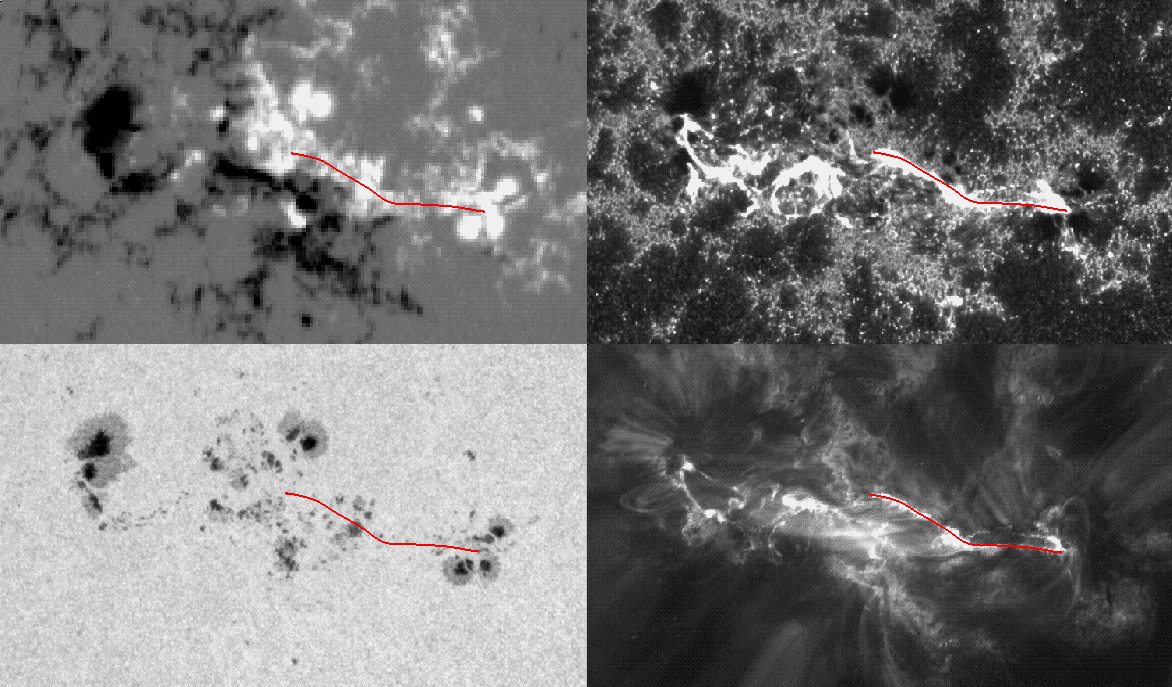
The two images on the left were taken on
25 June 2000, around 07:37UT (the images were rotated, so that north is
to the left). The image on the left shows a filament
in the process of being ejected from the Sun, with cool (dark) and
hot (bright; around 1.5 million degrees) material at opposite ends of
the long, nearly vertical structure. The second image is a 1600Å
exposure (logarithmically displayed), characteristic of material of
approximately 100,000 degrees. The third images is a
195Å exposure taken
2h 10m later. It shows a rapidly cooling arcade of loops. The geometry
is that of a funnel, as illustrated in the rightmost panel:
the loops near the front are higher than those
behind it, creating the impression of a crossed set of loops. The high
brightness at the apparent crossing point
is a consequence of many overlapping loops
that all contribute to the total intensity because of the transparency
of the coronal gas.
|
 |
A collage of TRACE and SOHO/MDI images of
a flare in progress. The flare occurred on 12 November 1999,
around 09:10 UT. The images are: top-left, magnetogram;
top-right, 1600Å passband; bottom-right, white light; bottom-left,
195Å channel. The red lines in the four panels in the full-resolution image
help to identify the features in the successive images: the footpoints
of an arcade of loops, faintly glowing in the 195Å image, light up
brightly as a ridge in the 1600Å image as energy impacts on the lower
domains in the atmosphere; the ridge runs through the middle of the white
polarity, presumably outlining different domains of magnetic connectivity.
|
 |
 |
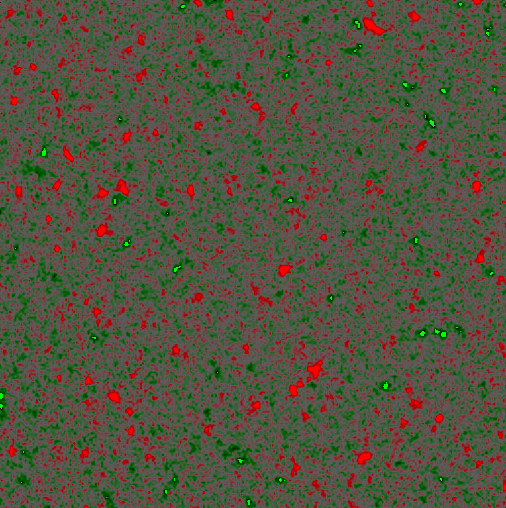
These images were taken on
10 June 1998, around 20:45UT. The top image is a 260-second
TRACE 171Å-passband exposure
(showing gas at around 1 million degrees); the lower image is a SOHO/MDI
magnetic map of that region, showing the two opposite polarities in
red and green. The third image shows
an overlay that shows that the strongest coronal brightenings
occur whenever two strong concentrations of magnetic field of opposite
polarity are close together.
|
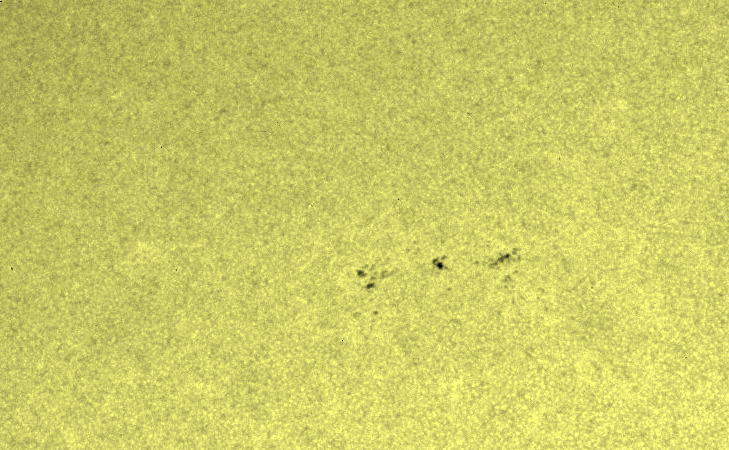 |
Two images taken on 8 May 2000 of
active region AR 8983, around
00UT. Despite the impressive appearance in the corona (top images, 171Å
passband, characteristic of 1 million-degree gas), sometimes little is
seen in the photosphere (bottom image, white-light channel, roughly 4,000
to 6,000 degrees); in this case only a few small pores are seen.
Courtesy: Dawn Myers.
|
 |
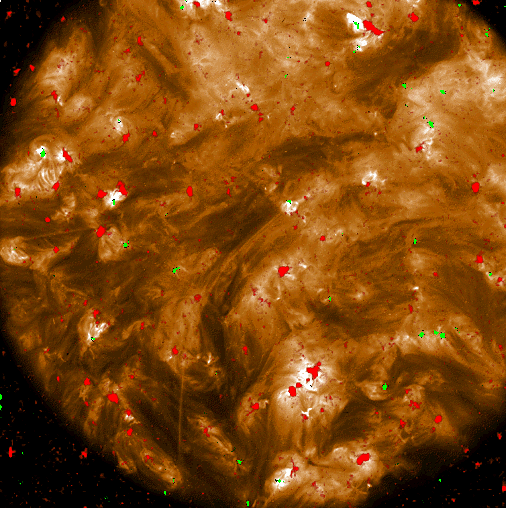
Observation of
Active Region 9017, made on 2 June 2000,
at 00:00UT. The image is a blend of a 1600Å image (showing the solar
surface combined with the transition region seen in CIV, i.e. with
temperatures ranging from 4,000 to 100,000 degrees) and a 171Å image
(characteristic of 1MK gas). The green image shows the position of
a substantial sunspot, and of the surrounding magnetic plage seen in
the transition region. The gold image shows the brightest of the
coronal loops ending in what appear to be faint brightenings in the
umbra of the spot, and the lower ends of the 3-5 million-degree loops
terminating in bright patches of ``moss'' that are the top of the
conductively dominated transition region.
|
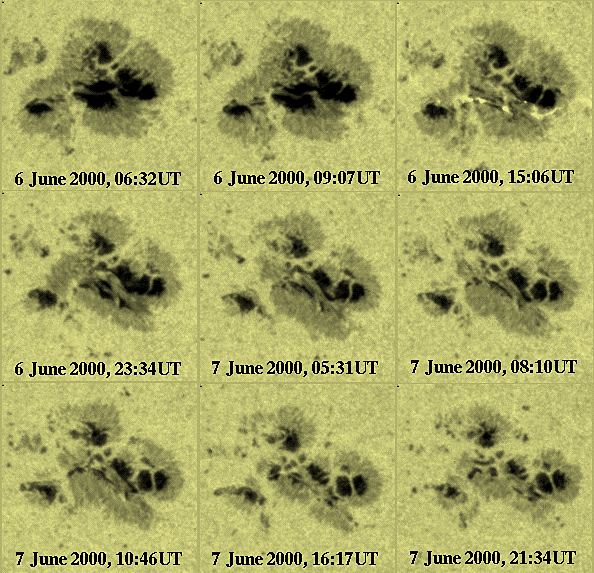 |
Composite of nine white-light images
taken by TRACE of the central spot complex in Active Region 1926 that
produced three X-class flares on 6 and 7 June 2000
(see
earlier TRACE images). The spot, in which two polarities are combined,
evolves so that the lower-central umbral region (the darkest part of
the spot) contracts, resulting in a flare (visible even in white-light
as a faint whisp in the upper right panel). The umbrae open again briefly,
then to disappear altogether. Once that process is completed, the spot
evolves rapidly into a decaying cluster of small spots and pores. Look
at the 0.9MB
that shows the evolution from 6 June 2000 at 05UT through 9 June 07UT;
the movie has been only crudely aligned, and shows 1% of the available
exposures.
|
|
| Home | Mission | Instrument | Team | Operations | Results | Images | Movies | Education | Site Info. | |