
The TRACE images may be used without restrictions
in publications of any kind. We
appreciate an acknowledgement indicating that
the Transition Region and Coronal Explorer, TRACE,
is a mission of the Stanford-Lockheed Institute for Space
Research, and part of the NASA Small Explorer program. More information on
TRACE and other TRACE images can be found
here.
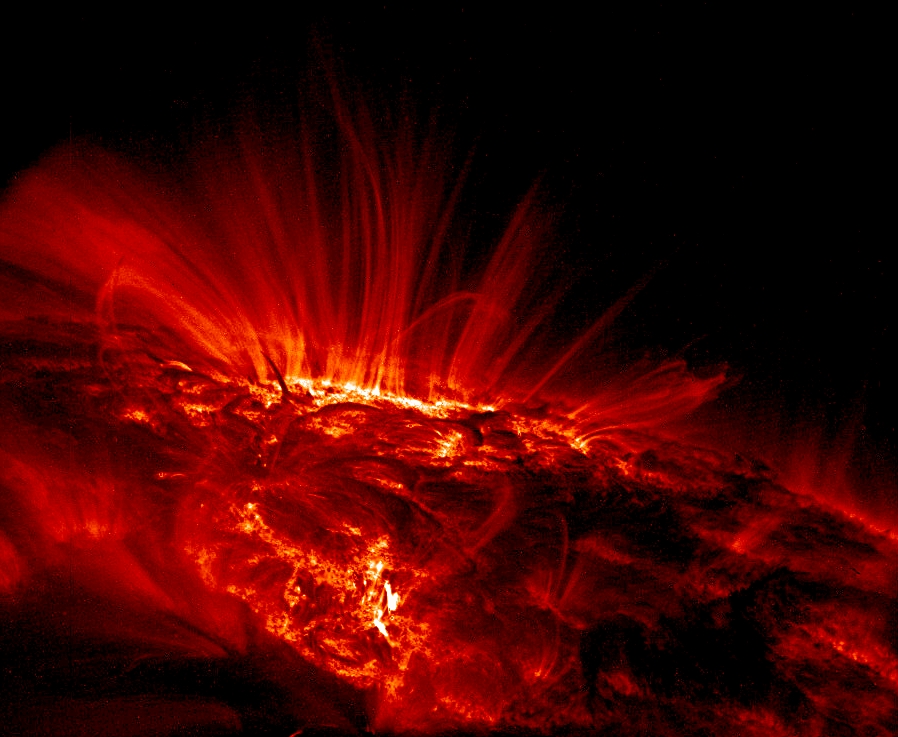 |
A quiet day on the Sun. No spectacular
flares or mass ejections, no odd filaments moving, and nevertheless
the image of AR 9169, with the much smaller AR 9167 just ahead
of it, is very pretty. This image was taken with TRACE in the 171Å
passband, showing the bright emission of the gas at about 1 million
degrees, with the cooler material around 10,000 degrees showing up
as dark, absorbing structures.
|
  |
These images of AR9154 were observed
on 12 September 2000, around 11:41UT. They show a system of coronal
loops at 1 million degrees (top) and at about 10,000 degrees (bottom).
These loops are cooling down following what was probably a
a C4.6 flare in the region that occurred at 08:55UT. Note the filament
that runs from the active region to the left (south); it shows up clearly
in the Lyman alpha (1216) image, even obscuring some of the active-region
loops behind it, but is seen in the 171Å image only as dark whisps gliding
erratically through the corona, suspended in the magnetic field. The images
have been rotated, so that north is to the left.
|
 |
Looking through the solar atmosphere.
The central image is a three-color
composite of the solar corona, observed with
the Transition Region and Coronal Explorer (a NASA Small
Explorer mission). This mosaic is made up of 3 exposures
at each of 23 pointings; the green, blue, and red color tables in this
``true color'' image represent the 171Å (1 MK), 195Å (1.5 MK),
and 284Å (2 MK) channels, respectively. The surrounding
images are, clockwise starting from the top: SOHO/MDI magnetic map,
white light, TRACE 1700A continuum,TRACE Lyman alpha, TRACE 171Å, TRACE 195Å,
TRACE 284Å, YOHKOH/SXT X-ray image. The composite was prepared by Joe Covington
(Lockheed-Martin Missiles and Space, Palo Alto).
|
 |
Coronal mass ejection
shows the flare and mass ejection as a difference movie: where the
image turns bright, the solar corona has become brighter after 16UT,
and where it turns black it has dimmed. This shows the ejected material
very well, first flying upward at several hundred kilometers per second.
Later, some of it is seen to fall back as a dark cloud.
|
 |
Magnetic X point |
 |
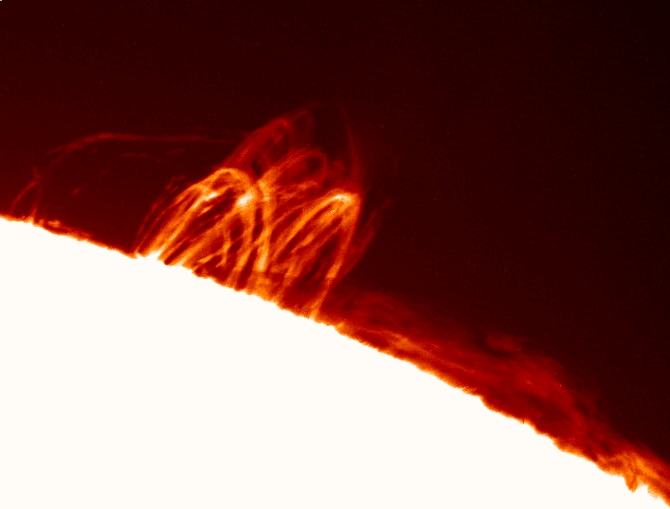
This is a still image in 171 Angstroms of a filament that is partially
erupting. A filament is a structure in the corona consisting of relatively cool
plasma supported by magnetic fields; the material is dense enough to
absorb extreme ultraviolet light emitted by regions of the hot corona
behind them. This image was taken by TRACE on
30 August 2000, at 22:33UT. Courtesy: Dawn Myers.
|
 |
Flare shakes the corona!
shows that in half resolution (showing only every 2nd exposure in
our database). The high loops are so faint, that a normal intensity
scale would not have shown them; the contrast in the images had to be
reduced considerably to bring out these oscillating loops.
|
 |
This is a snapshot of Active Region 9139 observed with TRACE
in the 1600Å passband, showing bright material around
100,000 degrees. The associated
7MB
shows three days in the life of the region (from 11:20 UT on 23
August 2000 until 04:10 UT on 25 August 2000). The movie (with
one frame every 7.5 minutes - showing 1/4 of all frames available)
shows the field in the relatively compact active region shifting
around in response to the convective flows. Note the continuous
streaming of bright elements in the perimeter of the large sunspot on
the right: although it appears that things are streaming away from
the spot, the spot does not noticeably decrease in size, nor is there
an accumulation of field in at the outer perimeter of the region where
the streaming is seen. What exactly is going on here (a common
feature of most sunspots) is still under study. Note also the faint
flickering of the entire field of view: this is caused by sound
waves that make the Sun ring like a bell (listen to it
here) and are used
in
helioseismology.
|
  |
|
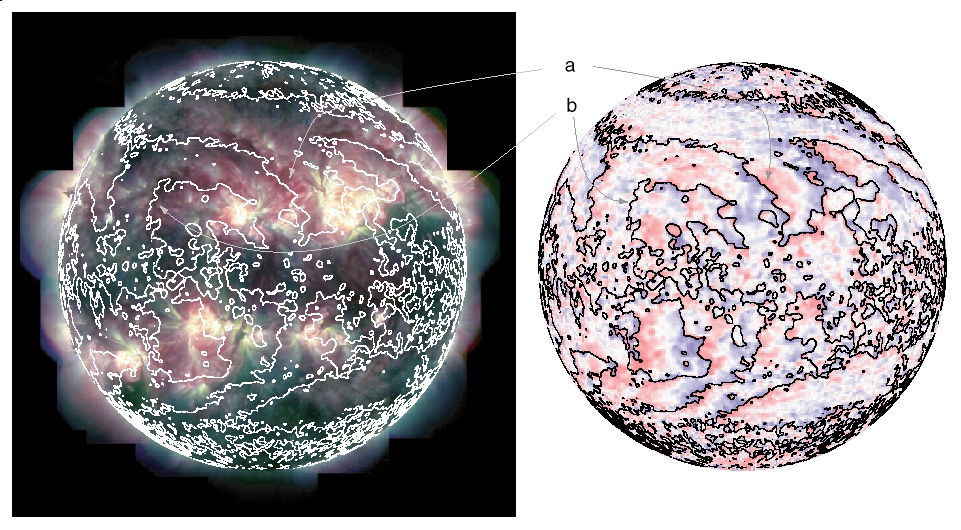 |
A comparison of an image of the solar corona and of the magnetic
field direction at the solar surface (the thumbnail on the right,
rotated version of the original, is too small to show enough details:
click on it to see the large version). The image on the left is a full-disk
mosaic of TRACE images (made up of 3 exposures
at each of 23 pointings; the green, blue, and red color tables in this
``true color'' image represent the 171 A (1 million degrees), 195 A
(1.5 million degrees), and 284 A (2 million degrees) channels, respectively).
The white lines show where the magnetic field at the surface are
magnetic neutral lines where the surface field vanishes. The image
on the right is based on magnetograms observed with the
150-foot solar tower at
Mount Wilson. It
shows the same neutral field lines, while the colors indicate the
direction of the magnetic field (as estimated by comparing measurements
taken days apart, using the solar rotation to get a different view of the
field): blue means that the field at the surface
is tilted towards the right (West on the Sun), and red that the field is
pointed towards the left (East). Wherever blue is to the left of a neutral
line and red to the left, the field is expected to arch over the neutral
line, and indeed we find arcades of loops in the TRACE image (as near ``a'').
Where the colors adjacent to the neutral line are either reversed or the
same on both sides, the field is more open and no coronal arcade is seen
(as near ``b''). Image courtesy of
Roger
Ulrich (UCLA).
|
|
| Home | Mission | Instrument | Team | Operations | Results | Images | Movies | Education | Site Info. | |