

The TRACE images may be used without restrictions
in publications of any kind. We
appreciate an acknowledgement indicating that
the Transition Region and Coronal Explorer, TRACE,
is a mission of the Stanford-Lockheed Institute for Space
Research, and part of the NASA Small Explorer program. More information on
TRACE and other TRACE images can be found
here.
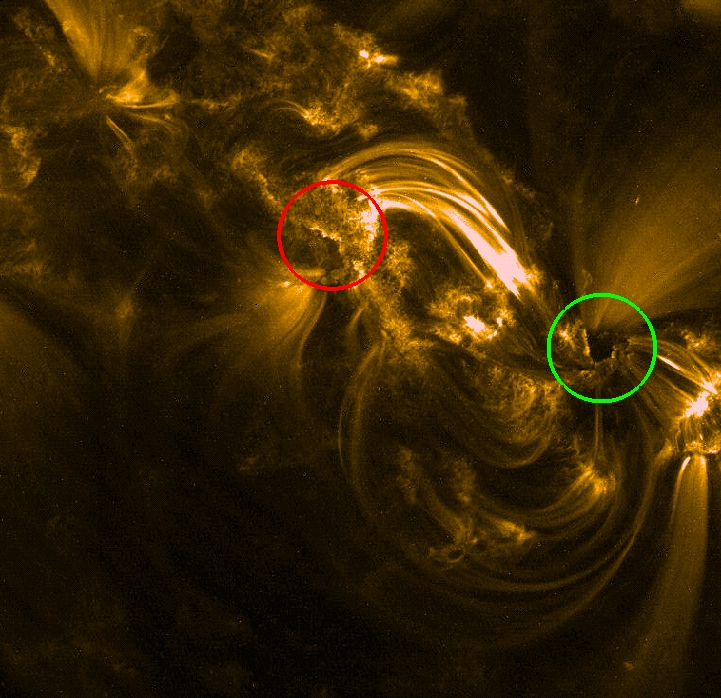 |
This is a snapshot of Active Region 9114 observed with TRACE on 9 August
2000. The image was taken in the 171Å passband, and shows material around
1 million degrees. The associated
1.2MB
shows the rapid evolution of this region even though there were no
obvious flares. The movie, showing the evolution from 13:17UT to 19:21UT,
shows every 5th TRACE frame at only half the resolution, i.e.
shown with ~750km for each pixel. The green circle (click here for an
image
without circles)
is centered on a sunspot, that shows a bright ring at the
umbral-penumbral interface in this image. This spot has been rotating
gently for the several days that TRACE observed it, and the movie
shows that that continues in these observations. This somehow triggers
a magnetic reconfiguration leading to many rapidly evolving loops between
the two circles. The red circle shows the reticulated, mossy emission
pattern from the footpoints of hot loops. Note the rapid evolution of
the brightness of that pattern in the red circles: first the emission
fades, then a front moves over it from north to south, and then
the cooling loops over it drain their material onto the surface, leading
to a series of short-lived bright loop footpoints.
|

 |
A major solar flare produced an arcade
resembling a slinky. That flare has featured here before, but this time
we are showing a set of composite images that shows the thermal evolution
of the material. The X5.7 flare occurred at 10:03UT on 14 July 2000,
in Active Region 9077, and was observed by TRACE in three colors:
the red image shows the ultraviolet continuum, generally characteristic of
cool, dense gas; the blue image shows the 171Å pass band, characteristic of
material around 1 million degrees; the green channel shows material hotter
than about 1.5 million degrees up to approximately 10 million degrees.
The top image is a collage of six images. Frame 1, right after the onset of the flare, shows very bright, rapidly evolving flare kernels and the beginning formation of ridges, or ribbons, that give this ``two-ribbon flare'' its name. Frame 2 shows an image around 10:25UT, 22 minutes later, when the ribbons have developed along much of their length, and loops connecting them are showing up on the right-hand side of the arcade. Frame 3 shows a bright ridge between the ribbons; this is presumably very hot material, but it remains unclear whether that lies below or above the now cooling loops connecting the ribbons. Frame 4 shows green loops forming on the left-hand side, that cool to blue in frame 5. In Frame 6 most of the arcade loops have cooled to around 1 million degrees. Because TRACE observes gas of
very different pass bands, it allows us in principle
to perform a very detailed study of the thermal evolution of this flare,
which was very large, and caused the largest particle storm of the
cycle thus far. To get a feel for the intricacy of the development, look
at the 1.3MB
The lower image shows a model of what may be happening (from Leon
Golub): A filament rose through the overarching field, tearing it open
in the process. The field then reconnects below the filament, releasing
highly energetic particles that then travel down the field to cause the
two bright ribbons as the particles hit the lower, denser material. Material
evaporates into the loops, causing the bright, hot loops. As the
loops subsequently cool, the green, hot loops, turn into cooler blue loops,
and eventually will fade altogether.
|
 |
``Rain'' in the solar corona. Whenever
the heating of the corona is temporarily stopped, the hot material cools
down by radiation into space and conduction to the cool footpoints. As it
cools, it slides down the magnetic field towards the solar surface. In this
TRACE image (taken in the Lyman alpha passband on 29 May 1999) we see
material falling down at a temperature of approximately 10,000 degrees,
that is a factor of 100 cooler than the hot corona. The matter falls in
clumps, showing up along only an occasional loop. In a four-hour interval,
shown in this image, much of the field shows coronal rain. This image
shows the maximum brightness at any one pixel during that four-hour interval;
as a result, it looks like a stroboscope photograph, with particularly bright
falling clumps showing up on successive locations as it falls, creating a
flashing track.
|

 |
Hard to see on any single image, this
prominence shows a marvellous combination of what appear to be twisters
on the Sun evolving into a fountain of hot material towards the end
of the 5.6MB
that
shows eight hours of the evolution of the prominence.
The movie (observed on 2 August 2000 in the 171Å
pass band of TRACE) shows cool, dark material embedded in the hot corona
(as on the top image on the right).
The cool material has a temperature probably close to 10,000 degrees
and therefore shows up as a glowing structure in the SOHO/EIT HeII/304
and Pic du Midi Hydrogen alpha images - in the two bottom figures on the
right (not on the same scale!) -
which show singly ionized helium and neutral hydrogen, respectively.
In contrast,
the glowing, hot material in the TRACE images is at approximately 1 million
degrees.
|
 |
Two versions of the same image show what
can be hiding in the dark. The images are taken with TRACE in the
1216Å pass band, containing Hydrogen Lyman alpha as the strongest
contributor, of Active Region 9077 at the Western solar limb (rotated
by 90 degrees, so North is to the left), taken at 8:57UT on 20 July 2000.
The top image shows the solar image properly scaled for the signal on
the disk, but the bottom false-color image shows how much weak emission
is hiding in the dark. That signal would normally not be measurable if
we exposed with a standard exposure that is good enough on the solar disk.
But on extra long exposures (10 times longer than standard), the relatively
dim material shows up clearly. Almost everything above the limb is material
that is no longer heated, cools very rapidly, and falls down to the surface.
Only a few structures in this snapshot correspond to material being
thrown upward. Even that will turn into ``coronal rain'' shortly afterward.
|
 |
This image is a 171 A image taken by TRACE on 25 July 2000, showing
million-degree plasma. The image shows AR 9097 at 08:09 UT. There is a set
of loops that formed around 08 UT, possibly brought on by a large flare
that occured a few hours earlier. Note the very bright kernel in the
southern loops; such a brightening is frequently observed in rapidly
evolving loops, but its nature remains a mystery. Courtesy Dawn Myers.
|
 |
TRACE 171Å image, showing emission
from gas at 1 million degrees, of Active Region 9077 on 19 July 2000, at
23:30UT. The image (rotated over 90 degrees, so North is to the left)
shows a filament in the process of lifting off from the surface of
the Sun. The dark matter is relatively cool, around 20,000 degrees, while
hot kernels and threads around it are at a million degrees or more. From
footpoint to peak, this rapidly evolving structure measures 75,000 miles.
Also the Astronomy Picture of the Day for
9 August 2000.
There is also a set of three black and white images, showing the same
scene in
171Å,
1600Å, and
white light.
|
 |
This image of Active Region 9077, which produced
massive flares over the past few days, shows a relatively small ejection,
along the arrow. The ejection appears to originate in a small, new
magnetic region that emerges next to the large active region (just
below the beginning of the arrow). In a period of some six hours, the
region catapults matter up into the corona a dozen times.
The ``bullets'' move with speeds of
up to 600 km/s, or 25,000 miles per hour! Look
at the 3.4MB
to see the ``heavy artillery''
in action. The movie shows the region in the 171Å passband
(material at 1 million degrees), from 11:50UT to 15:30UT on 19 July 2000.
|
 |
Sometimes coronal loops appear to
move rapidly from one place to another. But what are we seeing here?
Inside Active Region 9077 (seen in 195Å; 1.5 million degrees),
there is a loop that appears to move from
one side of a gap in the emission to another. Look
at the 0.42MB
to see the evolution of the loop within
the magnetic arcade. Or is it a sequence
of loops that lights up one after the other. Background radiation
hitting the detector in the middle of the process is not conducive
to a unique interpretation. The movie contains only 24 frames, from
09:43UT to 10:31UT on 15 July 2000.
|
 |
A major solar flare produces an arcade
resembling a slinky. The X5.7 flare occurred at 10:03UT on 14 July 2000,
in Active Region 9077, observed by TRACE in its 195Å pass band.
A filament in the center of the region destabilizes
and is seen lifting off. Following this mass ejection, an arcade of
magnetic fields lights up, cooling down from many millions of degrees.
Look
at the 6.8MB
to see the evolution of
the magnetic arcade. Note that the exposures have been rescaled to the
same peak intensity to show the evolution of the central bright region.
This causes the surroundings of the flare site to apparently dim
markedly as the flare reaches peak brightness. The field of view
is 230,000 by 170,000 km. This image also featured on the
Astronomy
Picture of the Day for 20 July 2000.
|
|
| Home | Mission | Instrument | Team | Operations | Results | Images | Movies | Education | Site Info. | |