

The TRACE images may be used without restrictions
in publications of any kind. We
appreciate an acknowledgement indicating that
the Transition Region and Coronal Explorer, TRACE,
is a mission of the Stanford-Lockheed Institute for Space
Research, and part of the NASA Small Explorer program. More information on
TRACE and other TRACE images can be found
here.
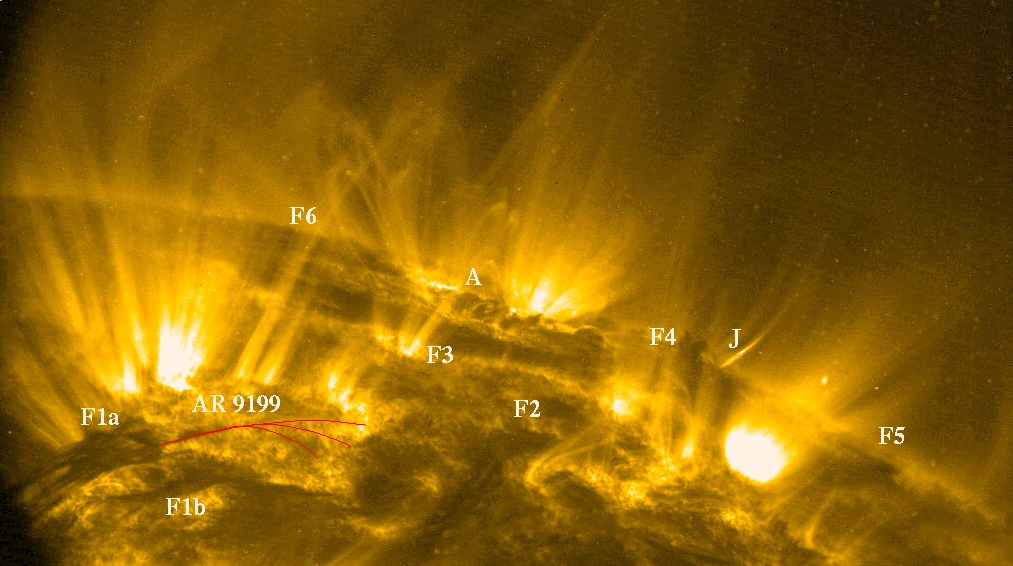 |
A quiet day on the Sun can still be pretty
complicated if you were a weather forecaster there. This image of the
northeastern solar limb (north is to the right) was taken by TRACE
on 17 October 2000, at 03:39UT in the 171Å passband, showing emission from
gas at approximately 1 million degrees. In the lower-left corner is
Active Region 9199, with a double filament (F1) reaching across it;
matter is flowing to the left, following the red curves, but so
intermittently that only a movie outlines the tracks. There are at
least five other filaments (F) in this image, plus a dark, cool
arcade of loops (A), and a short-lived jet (J).
|
 |
Short movie of the
activation of a tiny filament in Active Region 9192 leads to a series
of loop brightenings and a small, irregular two-ribbon flare, observed in TRACE
171Å band, 14 October 2000 19:30-24:00 UT. Courtesy: Charles Kankelborg.
|
 |
Coincidences happen. Or at least, that
is what we think we are seeing here. This TRACE image (171Å, showing
emission of gas around 1 million degrees) was taken on 16 October 2000,
at 00:25UT (rotated so that north is to the right). It shows a filament
destabilization in which material is lifted up, and then slides down again
as the magnetic field reorganizes. One of the footpoints is where
the lines that are drawn on the image converge.
These lines are drawn to guide the
eye along a cluster of short streaks on the detector. These are most
likely the result of an energetic particle bouncing off the satellite
somewhere near the detector, causing a shower of less-energetic particles
that leave a signal as they travel through the detector. The puzzling
thing is that the streak paths seem to converge right at the location
on the detector where the bright filament
footpoint is imaged. We think it is merely a coincidence, but we would
love to hear from anyone who thinks there is an explanation for this phenomenon
that links the particles to the flare!
|
 |
This composite image
(observed on 20 May 2000, 11:12UT) shows a 195Å TRACE
image (1.5 million degrees) in yellow blended with a SOHO/MDI magnetogram.
Spot group `A' is observed to rotate in the clockwise direction. This
distorts the corona such that the loop fan coming out of group B is
seen to rotate anti-clockwise, which in turn forces the fan coming out
of C to rotate clockwise (see this short
movie; 1.5MB, QuickTime, JPEG
compressed; field of view 640x480 pixels of 0.5 arcsec each).
The magnetic configuration is such that between the main spots labeled
A (negative polarity; blue), B (positive polarity; red), and C (negative)
there is a neutral point on the solar surface; field lines coming near
to that point (like the gray lines) diverge there and go into opposite
directions. The rotation of spot group A causes field lines to apparently
move through the X point (and the separator that appears to end in it),
so that field is being forced from connecting one pair of spots to another
pair of spots, reconnecting in or near the X point.
|
 |
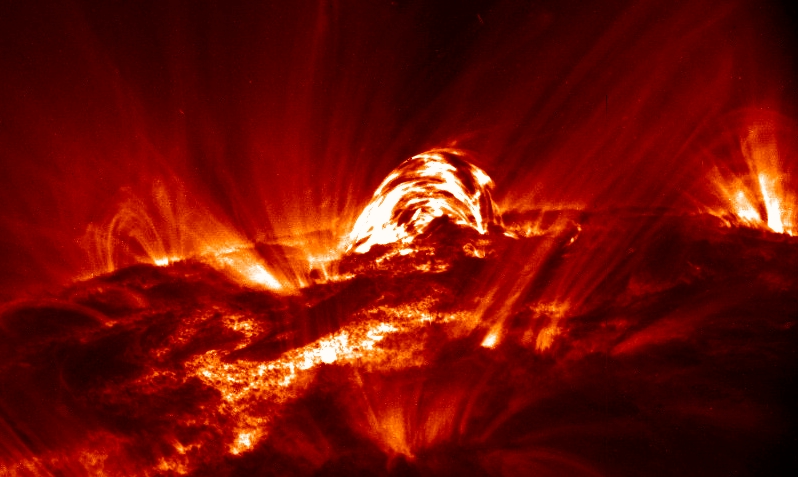
Looming up to 60,000 km (4.5 times
the size of the Earth) above the solar surface, the dark, cool
material of a prominence shows up embedded within the million-degree
corona. This 171Å image, taken by TRACE on 8 October 2000, at 21:51UT, shows
the complicated, filamentary nature of the prominence. What it does not
show is the complicated dynamics: this material sloshes back and forth
as the field distorts, sometimes warming up as heat is dumped in it,
and often giving the impression of whirling about as in a tornado. The
origin of these prominences (called filaments when seen on the solar disk)
remains a mystery. They are commonly observed between regions of opposite
magnetic polarity, but they align with the polarity-inversion line rather
than crossing it, as magnetic field lines should. The explanation for
that is sought in strong electric currents running through the solar
corona, distorting the field from the ordinary potential configuration.
But what drives the currents, and how they affect the field in detail
remains a mystery.
Click here
to see a this prominence
observed in H alpha (observing emission from relatively cool material)
as seen at the Big Bear Observatory.
|
 |
The big Coronal Mass Ejection obsered
on 14
July 2000 was accompanied by a large number of energetic particles. These
were first observed by SOHO, located one million miles closer to the Sun
than Earth. They were subsequently seen by satellites orbiting the
Earth. The geostationary
GOES satellite, for example, observed a 10,000-fold increase in the
proton flux. Much closer to
Earth, TRACE observed
these particles only when it was traveling over the Earth's
polar caps and through the south-Atlantic anomaly, while at other
times the Earth's magnetic field effectively shielded TRACE from the
storm (compare the
upper image on the left - taken while TRACE was within the anomaly - to
the lower one, taken when TRACE was safely shielded).
This diagram
shows the effect of the particles
hitting an otherwise dark corner of the TRACE detector; this corner
ordinarily is at a nearly-constant level of 85 units, but
that level increased during the storm every time TRACE traveled through those
areas of the Earth's magnetic field into which the storm could penetrate.
Such particle storms can damage the sensitive electronics on spacecraft.
This particular event caused the Earth's atmosphere to expand so
much that the Japanese satellite
ASCA started
to turn away from its normal attitude
because of the increased drag on its solar panels; the
satellite consequently ran out of power, and
could
not be saved.
Other satellites,
as well as electric power companies, experience trouble as the flare
effects hit the Earth.
|
 |
This TRACE image of Active Region 9169
shows a filament activation that occured around 23:53 UT (probably
associated with a C2.9 flare) on 29 September 2000. The small filament
(compare the image of the quiescent filament
just before
the activation)
rose up, and showed a tangled web of bright and dark strands, in which
material moves in either direction. Things gradually quieted down, and
after a few hours all was quiet as before.
|
 |
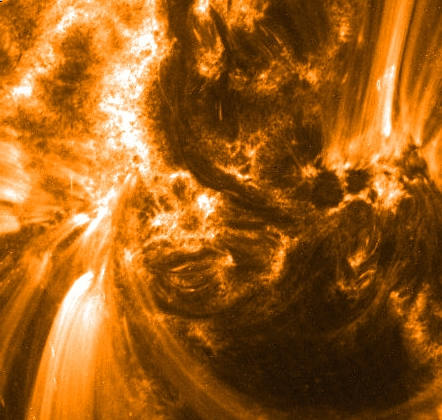
Image taken by the Transition Region and Coronal Explorer TRACE in the
171Å passband centered on Fe IX and X lines emitted by plasma at
temperatures around 1 million degrees.
The field (400 arcsec to a side; 1 arcsec equals 725 km) shows two
active regions at the northwestern limb of the Sun on 19 August 1998
at 0604UT. The image has been mirrored around the diagonal to that
north is to the right and west to the top. The image shows the narrow,
bright coronal loops within the two regions and some connecting them
as outlined by plasma around 1 million degrees. Most loops are substantially
higher than the associated pressure scale height, and as a result the
emission is concentrated in the lower segments of the loops (as near A
and B), but the fainter top parts of the loops can still be seen above
the limb. Fans of cool loops are often seen emanating from the
umbral-penumbral interface (B) or umbral light bridges; these fans
frequently show the coronal counterpart of running penumbral
waves. Some material at one million degrees can be seen high in the corona
in cooling post-flare loops (C and D). The bulk of the coronal plasma over the
magnetic plages is at temperatures well above one million degrees;
the conduction of
thermal energy downward results in a low-lying, rather thin pattern
of emission that overlies the top of the transition region in a
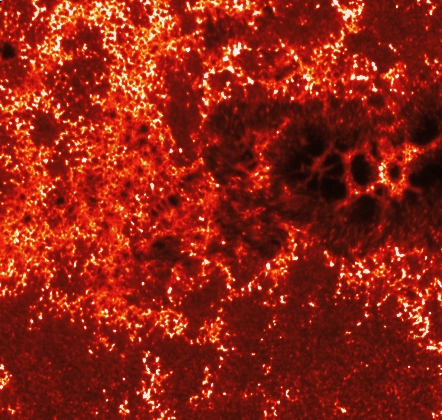
dynamic pattern now called ``moss'' (covering much of the magnetic
plages, particularly clearly near E). The fine structure in the moss
is the result of short-lived ejections of material at chromospheric
temperatures into the higher layers, absorbing the EUV radiation. At
the limb, spicules are seen in absorbtion; the forest of spicules is
so dense that the EUV limb is offset relative to the white-light limb
by about 4,000 to 6,000 km.
The cooling material in the tops of the loops near C
also absorb EUV radiation. More cool material can be found near F and
G. Cool material is being thrust up into a long-lived spray (F), that
persists for over 36 hours. The cool material reaches the top of the
field lines and spills over at the other side, falling back to the
solar surface. Both hot and cool material is seen to move upward along
different, intertwined paths. In the lower-right corner (G) part of a
filament can be seen. This filament is at the time of the exposure
wrapped in a rapidly evolving, fleeting pattern of brightenings
propagating across its outer envelope.
|
 |
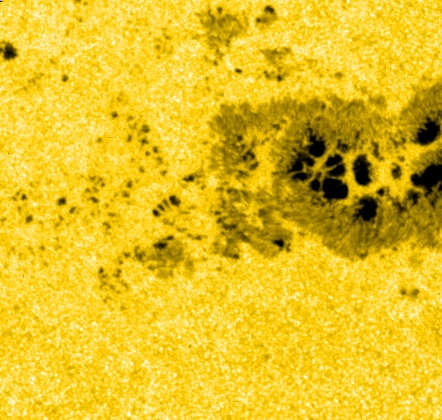
TRACE observations of Active Region 9169,
made on 24 September 2000, around 08UT. The visible-light image (top)
shows a very complicated sunspot group, with lots of small, dark pores
(small sunspots, without a penumbra formed by nearly horizontal field
surrounding the larger spots). The 1600Å image (middle) shows that
there is much more magnetic field on the solar surface that what can
be seen in white light: the entire upper-left area of the region is
full of magnetic field that lights up in the ultraviolet light, without
a trace in the white light images. Higher up in the atmosphere, the
hot corona (bottom image, showing gas at 1 million degrees) shows
magnetic loops ending in the field on the surface: where the loops
are very hot, only the footpoints are seen as the moss-like
patterns in the upper left, whereas cooler loops show up along much
of their length (lower left and upper right).
|
|
| Home | Mission | Instrument | Team | Operations | Results | Images | Movies | Education | Site Info. | |