

The TRACE images may be used without restrictions
in publications of any kind. We
appreciate an acknowledgement indicating that
the Transition Region and Coronal Explorer, TRACE,
is a mission of the Stanford-Lockheed Institute for Space
Research, and part of the NASA Small Explorer program. More information on
TRACE and other TRACE images can be found
here.
 |
TRACE observed this activation and partial eruption of a ring-shaped
filament on 20 September 1998, around 02UT. The image on the left
was taken in the 171Å passband, most sensitive to emission from plasma
at temperatures around 1 million Kelvin, at 02:36:49UT, during the
initial phases of the process. The image shows the outline of the
dark filament in the back and the two ribbons at the footpoints of flaring
loops in the front, together outlining the entire ring-shaped filament.
The entire process is shonw in this QuickTime/JPEG-compressed
movie (2.7MB; shown at half-resolution,
with a field of view of 480 by 640 original pixels or 0.5 arcsec each; images
rotated by 90 degrees clockwise so that north is to the right). The movie
shows the postflare arcade of loops cooling into the TRACE 171Å passband
first across the front of the filament, while the back part is lifting
off to form a coronal mass ejection. After part of the ejected material
slides under the arcade in the front, an arcade shows up in the back
also, forming an almost complete doughnut-shaped ring around 4:30UT.
Notice (a) that the initial flare ribbons form without obvious signs of
a segment of the filament in the front having lifted off; (b) that the
lower flare ribbon moves across the surface probably reflecting that
successively higher loops are involved in a reconnection process.
|
 |
The heating of the corona frequently stops long enough along magnetic loops
to cause them to cool rapidly, and to subsequently drain. TRACE sees the
later stages of such cooling as the material (originally some 3-5 million
Kelvin) cools into the 195Å passband (1.5 million Kelvin), then into
the 171Å passband (1 million Kelvin) and subsequently into the CIV (1600Å)
and Lyman alpha (1216Å) passbands characteristic of material at 100,000 Kelvin
and below.
This QuickTime/Cinepak movie (15.7MB)
shows the evolution of cooling loops over
Active Region 9004 on 26 May 2000, from 12 UT through 19 UT in 306 composite
panels. The four panels (clockwise from top left) show the 171Å
image, the ratio of 195Å to 171Å images, the ratio of
1216Å to 1600Å images, and the 1216Å image. The frames
nearest in time to the 1216Å are collected in the combined images.
The field of view is 640 by 480 pixels of 0.5 arcsec (~380 km) each, shown
here binned to half resolution. The images are shown on a logarithmic
gray scale (shown on the right of each panel) with ranges from
0.1 to 9.0 DN/sec/pixel, a ratio from 0.5 to 2, a ratio from 0.2 to 2.0,
and from 1 to 20 DN/sec/pixel, respectively. The images have been
rotated and mirrored, so that North is to the right, and West to the top.
(The movie also appears in a study of loop cooling by C.J. Schrijver,
published in Solar Physics, vol. 198, Issue 2, p. 325-345 (2001))
|
 |
TRACE observed the activation/eruption of a filament in Active Region 8631
on 20 October 1999, around 05:50UT. The image on the right, taken around
05:57UT, shows the filament in mid-eruption, with bright, hot material
(around 1.5 million degrees as seen in this 195Å image) and cool, absorbing
material mixed in close proximity (the field of view is 640 by 480 pixels
of 0.5 arcsec (~380 km) each). The (QuickTime; JPEG/A compressed; 3.7MB)
movie shows the evolution of the
eruption, from 05:50UT through 06:25UT. Notice that as the dark, cool
filament material begins to rise, hot blobs form throughout and around
the structure. The filament reaches its highest elevation around 06:00UT,
after which the the field continues to reorganize itself, as material
begins to cool and fall back. Notice the post-eruption arcade forming
below the filament as the loops in question cool to temperatures for which
this TRACE passband is most sensitive, i.e. around 1.5 million Kelvin.
|
 |
 On 20 July 1999, TRACE observed a small eruption within an active region. The lefthand image (taken at 00:46UT) shows the 1 million degree gas as observed in the 171Å passband. The image on the right is the corresponding magnetic map, as observed by MDI on SOHO (taken at 23:59UT on the preceding day; opposite polarities are shown as green/blue/white and orange/red/black as strength increases); the alignment is correct to within 2 pixels. The images show a field of view that is 190,000 km to a side. A small coronal brightening develops around 00:31UT in the polarity-inversion area near ``A'' (see the label in the large version of the righthand image). Around 00:38UT material is ejected nearly horizontally towards the upper-right as well as to the lower-left in a bidirectional ``jet.'' The material that is ejected southward travels trough the polarity inversion zone ``B,'' typically dark in the coronal 171Å emission, and fades away as it begins to curve back towards the sunspots at ``C.'' Yet around 00:45UT some faint brightenings near ``C'' show material reached that point, traveling at an average (projected) speed of over 200 km/sec. |
 |
The image, taken by TRACE on 9 February 1999,
shows high-arching loops connecting two active
region complexes across the equator. This
composite of nine exposures (171Å, 195Å, and 284Å at three pointings)
shows relatively cool plasma in red and warm plasma in pink.
The images of the eastern limb of the Sun
are shown binned to 1 arcsec pixels.
|
 |
This image shows a segment of a magnetically active region with some
of the surrounding non-active Sun, observed by TRACE in the 1600Å
passband (left) and the corresponding magnetic map (right) observed
with SOHO/MDI on 9 November 1999.
The TRACE image (10:13UT) shows as bright features the emission
from gas at about 100,000 degrees over the magnetic-field concentrations
on the solar surface, while the fainter emission is largely from gas at
around 5,000 degrees at the surface. The sunspot shows up as a dark
patch near the center of the image. The magnetic map, taken at 09:35UT,
shows opposite polarities as green/blue/white and
orange/red/black as strength increases. Note that the two small flares in
progress in the TRACE image occur between regions of opposite polarity in
the magnetic map. The (QuickTime; JPEG/A compressed; 1.2MB)
movie shows the evolution of these
flares, from 09:59:16UT through 10:49:18UT. Notice also the streaming
of bright features in from the center of the sunspot across its so-called
moat. Although it seems as if field concentrations
are moving away from the spot, there is rarely a measurable change in
the field surrounding the spot. Consequently, hypotheses have been postulated
that we are seeing waves rather than actual objects moving almost radially
from the spot.
Despite decades of study, the nature of these ``moving magnetic
features'' remains obscure. The bright pixels that show up near the
end of the movie show where the camera was hit by energetic particles
as TRACE moves towards the Earth's magnetic pole. The black bands in some
of the images occur whenever a small package of information is lost
in the transmission of data from the spacecraft to the groundstation.
|
 |
Now you see them, now you don't. The rapid cooling of loops, and the
associated draining of material from them in episodes of coronal rain,
have been shown in these images several times. Often that is the
only way to actually see the structure of the magnetic field.
This movie
(QuickTime; photo-JPEG compressed; 1.3MB; field of view is 640 by
480 pixels of 375 km each, reduced to half size in the movie compared to
the single still image; rotated so that north is to the left)
shows the evolution of a set
of cooling loops, from 05:55UT through 08:10UT on 3 September 1999, observed
in the 171Å passband of TRACE seeing emission from gas around one million
degrees). But notice how difficult it is to guess what is going on: are
loops moving as they cool, or do we see successive loops cool into and
out of the temperature interval that TRACE can see? Notice also that
the rapid loop cooling is associated with substantial brightening of
a set of footpoints; but why on only one side? Should we look for the
other footpoints in the leading sunspot?
By the way: the black bands in some
of the images occur whenever a small package of information is lost
in the transmission of data from the spacecraft to the groundstation.
|
 |
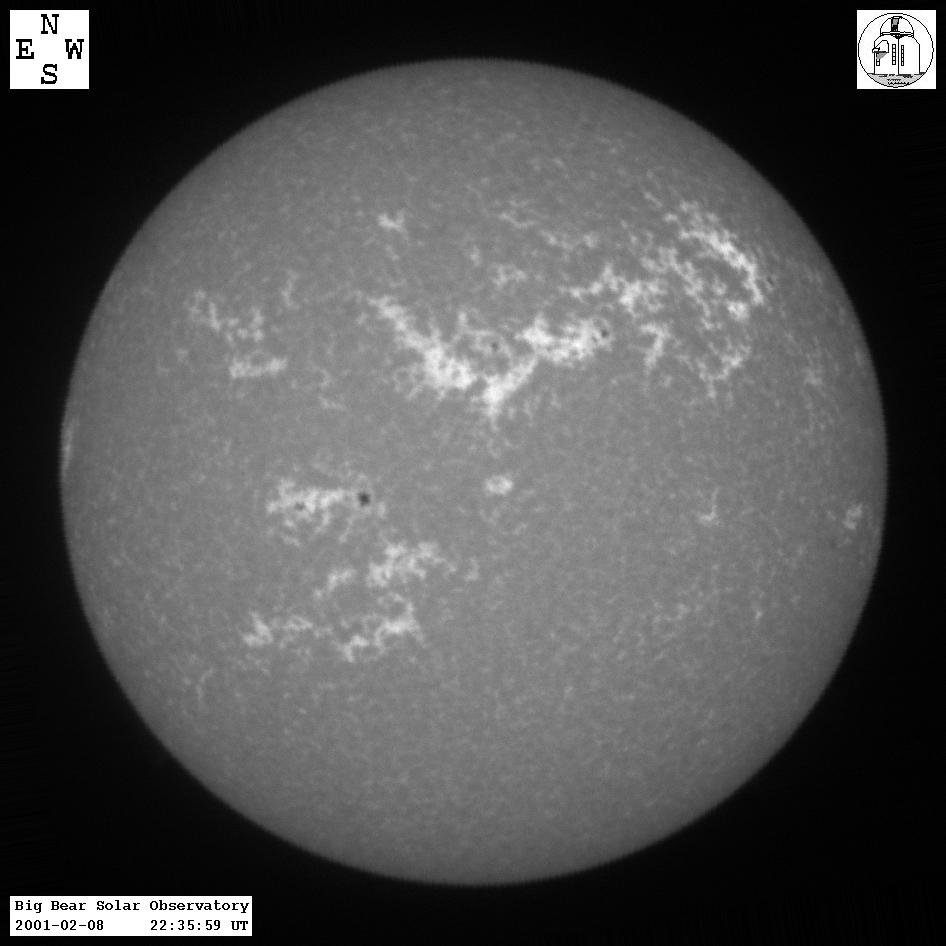
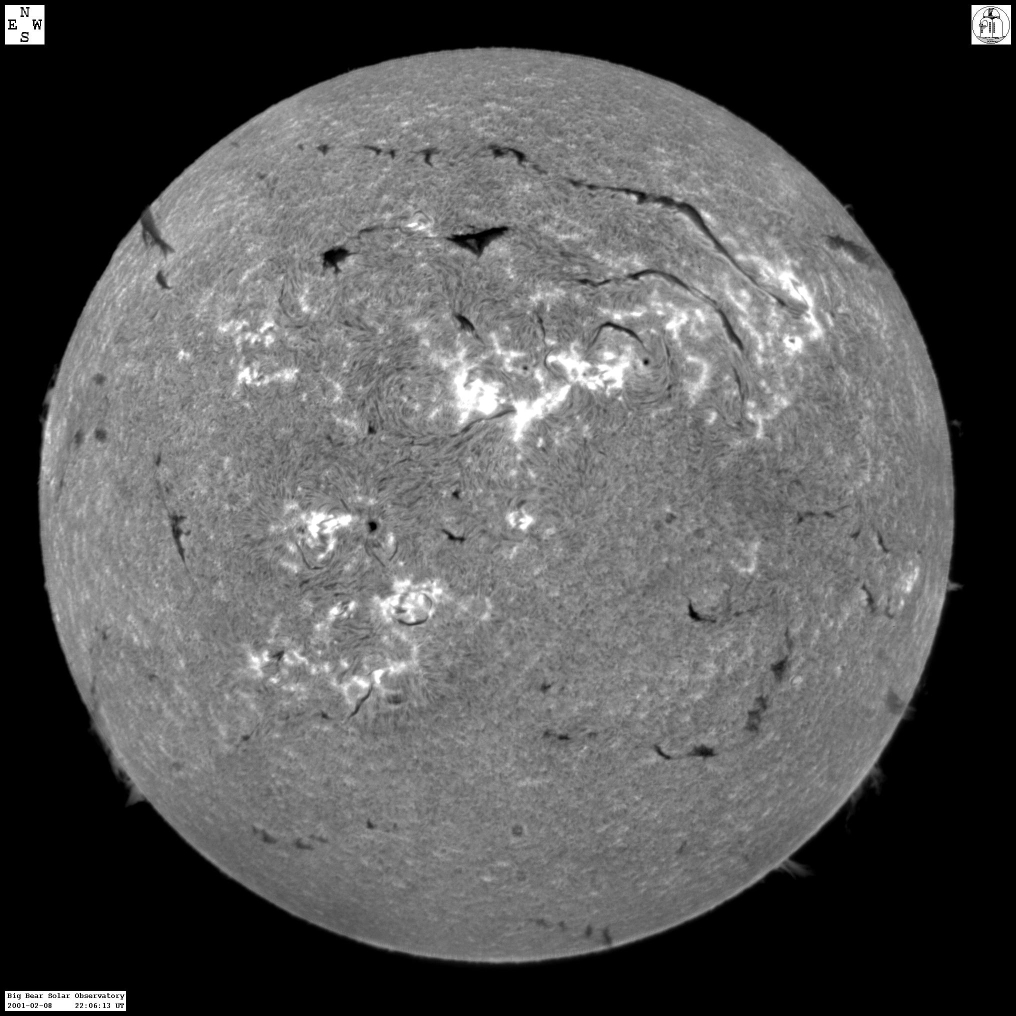 Three views of the Sun taken on 8 February 2001: the image on the left is a low-resolution version of a full-disk mosaic of TRACE 171Å (one million degrees) images; the central image shows the Sun in the light of singly ionized Calcium (CaIIK; most sensitive to emission originating around 10,000 degrees); the image on the right is taken in the light of the hydrogen Balmer alpha (Ha) line, which is formed over a range of temperatures up to some 20,000 degrees. Notice that the patches of magnetic field that light up in the CaIIK image also show up bright in the Ha image; these show the lower parts of the solar magnetic field that higher up form the arches (coronal loops) in the TRACE image on the left. The dark filaments that show up in the Ha image can be vaguely recognized in the TRACE image because the filaments absorb the extreme ultraviolet emission from any part of the corona behind it; the filaments are too cool and tenuous to show up in the CaIIK image. The two images on the right were taken at the Big Bear Solar Observatory. |
 |

 These three images are of Active Region 9334 taken by TRACE on February 9th, 2001 at about 03:32UT. The 195Å image (left; gold) shows the coronal gas that has a temperature close to 1.5 million degrees. The white light image (right; gray) shows the sunspots as seen on the solar surface, also know as the photosphere; temperatures range from about 4000 Kelvin in the spot cores to 5700 Kelvin at the brightest areas. The sunspots, which form whenever there are substantial areas of concentrated magnetic field, are also seen in the 1600Å image (center; red). That image also shows the many bright patches of emission that identify the location of concentrations of magnetic field that are not large enough to form dark spots. Temperatures in this 1600Å image range from 5000 degrees in the spots to 100,000 degrees in the brightest patches. The field of view is 500 arcseconds of 725 km; the dark circle is not the edge of the Sun, but rather vignetting that occurs by the filterwheels in the telescope. Courtesy Dawn Myers. |
  |
The flare that went off in the magnetic region to the left just
before the start of the
TRACE 171Å movie
(QuickTime; photo-JPEG compressed; 2.9MB; field of view is 640 by
480 pixels of 375 km each
of cooling loops, from 06UT through 07:30UT on 2 September 1999, observed
in the 171Å passband of TRACE seeing emission from gas around one million
degrees) causes ``moss'' to form in the center of the image as material
impacts the lower atmosphere from below. But notice how little magnetic
field (lower image on the left, taken at 17:35UT,
showing opposite polarities as green/blue/white and
orange/red/black as strength increases) there is below the moss
for the active-region field to connect to. Also notice that the
reorganizing magnetic field, largely invisible to TRACE, somehow
pushes the loop fan just southward of the moss out of the way.
|
|
| Home | Mission | Instrument | Team | Operations | Results | Images | Movies | Education | Site Info. | |